

Executive Summary
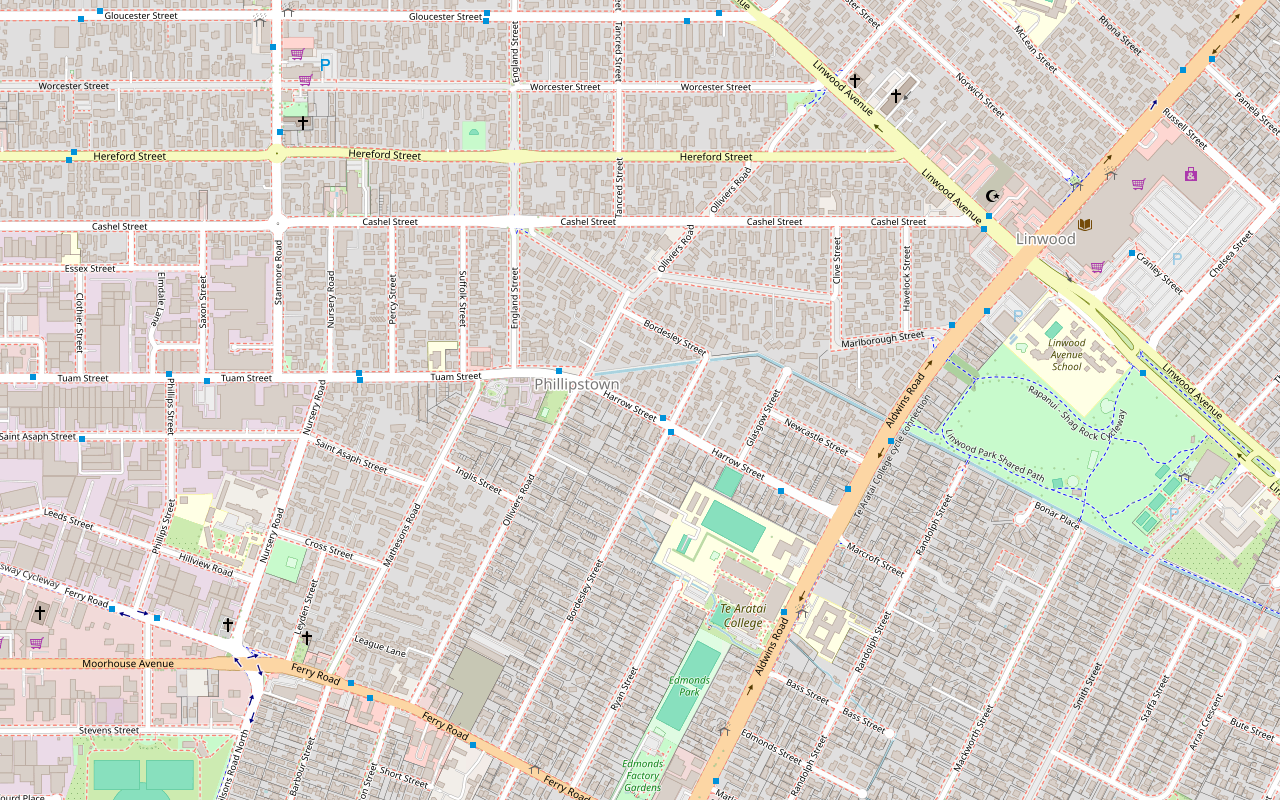
The property achieves an overall environmental score of 8.4/10 (Good), supported by excellent air quality with an annual PM2.5 mean of 7.1 µg/m³ and strong crime safety metrics showing a declining trend across most categories. Traffic noise at 66.3 dB Lden exceeds the NZ residential standard of approximately 55 dB by over 11 decibels, and combined with railway noise from five nearby level crossings within 1.5 km—each producing peak horn levels around 73–74 dB—presents a sustained acoustic environment that prospective buyers should assess through site visits, particularly during evening and night hours when annoyance weighting is highest.
About Christchurch
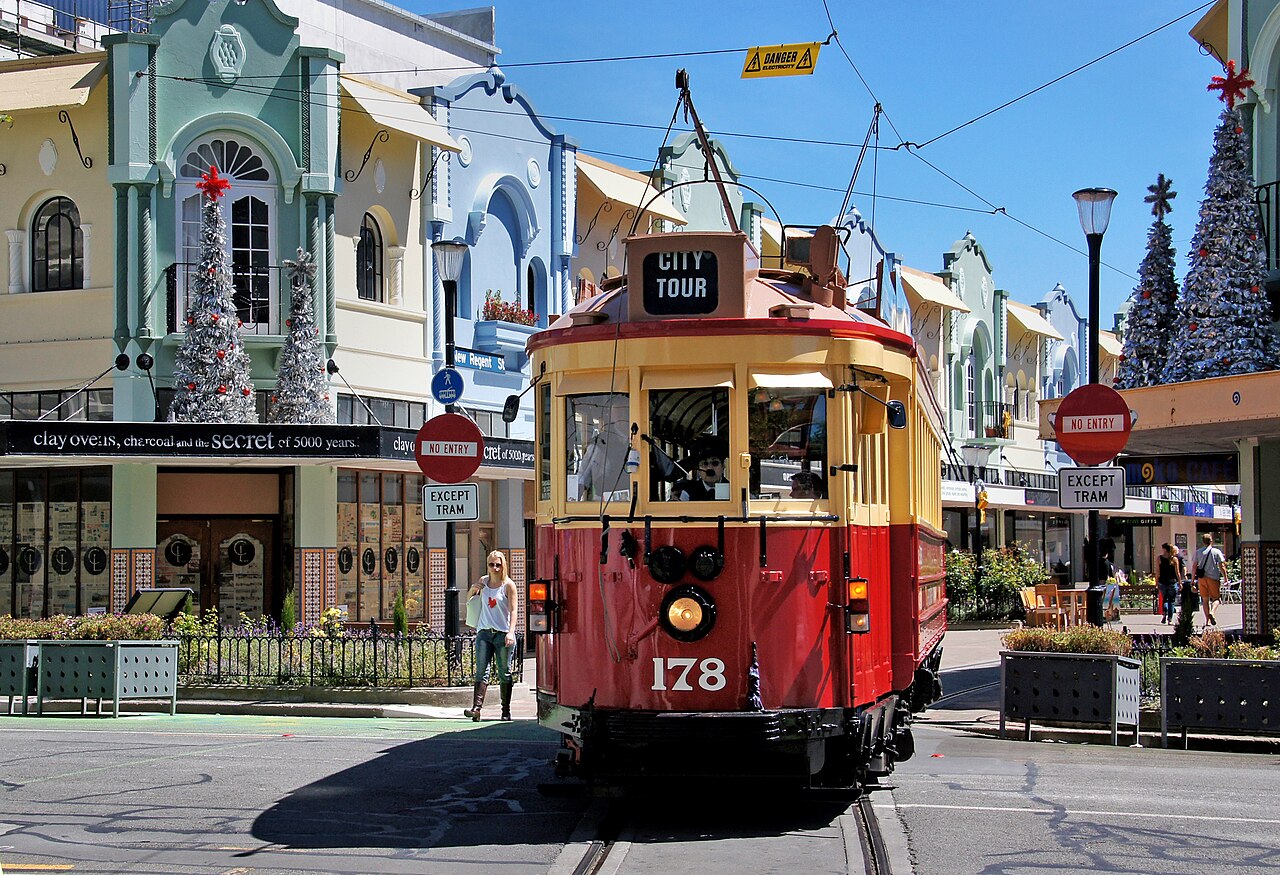
Christchurch — Ōtautahi — is the South Island's largest city, home to around 400,100 people across a broad 1,426 km² footprint that stretches from the flat Canterbury Plains to the Port Hills above Lyttelton Harbour. More than a decade on from the devastating 2010–11 earthquakes, the city's rebuild has produced striking contemporary architecture and a revitalised Ōtākaro Avon River Corridor, giving Christchurch a refreshed urban core while retaining its reputation for flat, cycle-friendly streets and a measured, spacious feel quite different from Auckland or Wellington. The economy is anchored by agricultural services — Canterbury's dairy and arable farming is among the most productive in the world — alongside growing technology and logistics sectors, and significant employers including Fonterra, Countdown, and BNZ regional operations. The University of Canterbury and Lincoln University give the city strong research credentials, particularly in agricultural science. Christchurch International Airport is the South Island's main hub, and with ski fields, the Southern Alps, and Antarctica's gateway all accessible, the city offers an exceptionally active outdoor lifestyle alongside a four-season climate that delivers warm summers and crisp, clear winters.


Air quality: ML model trained on LAWA monitoring stations. | Noise: CoRTN road-noise model from NZTA/OpenStreetMap road network. | Crime: NZ Police victimisation data. | Full source details in each section below.
 Property & Market
Council Valuation (CV)
| Land Value | NZD 200,000 |
| Improvements | NZD 160,000 |
| Land / Total | 56% land |
Capital Value (CV) set at the 2022 revaluation. CV is a mass-appraisal estimate — individual properties may vary. Market value is typically 10–30% above CV in rising markets.
 Estimated Council Rates
| Council | Christchurch City Council |
| Rates Year | 2025/26 |
| Valuation Basis | 0.463% of CV |
| Fixed Charges | NZD 389 |
Estimate based on published council rates. Actual rates may differ based on property category, location-specific targeted rates, and water metering. Check your council's rates calculator for exact figures.
 Insurability Outlook
Some moderate hazard exposure. Cover should be available but expect it to influence the premium or excess — worth comparing insurers.
| Hazard | Insurer view | Source |
|---|---|---|
| Earthquake / liquefaction | Moderate Liquefaction susceptibility is a key driver of earthquake cover terms. | Regional council geotechnical mapping |
No public data source can confirm with certainty whether a specific address will be accepted by an insurer — that decision sits inside each insurer's own underwriting model. This outlook reflects the mapped hazard signals insurers are known to use. Always obtain a written quote in your own name before going unconditional, and check the policy is assignable or that fresh cover is available on settlement.
- Liquefaction susceptibility is a key driver of earthquake cover terms.
- The Natural Hazards Commission accepted more claims in Christchurch City than the national average per district, largely landslip. This is a district-wide signal, not property-specific.
Before you buy — insurance checklist
- Request a current insurance quote in your own name before going unconditional.
- Ask specifically whether flood, coastal, and earthquake perils are included or excluded.
- Confirm the excess for each major peril, not just the standard excess.
- Check the sum insured covers full rebuild cost, not the market or purchase price.
- On an existing policy, confirm it can transfer to you or that new cover is available.
The indicative premium is modelled from automated value estimate as a proxy for rebuild cost, a country base rate calibrated to published market averages, and the mapped hazards above. It is a guide only and is not a quote. Actual premiums depend on the building, your claims history, and each insurer’s own assessment.
 Suburb Rental Bonds
Rental bond lodgement data for Phillipstown (SA2 area) from MBIE Tenancy Services. Shows median weekly rents by bedroom count based on bonds lodged in Jul 2025.
| Bedrooms | Median Rent | Range | Bonds |
|---|---|---|---|
| 1-bed | $355/wk | $284 – $394 | 21 |
| 2-bed | $475/wk | $448 – $500 | 27 |
| 3-bed | $550/wk | $500 – $580 | 30 |
| All sizes | $480/wk | $396 – $529 | 111 |
Source: MBIE Tenancy Bond Data (tenancy.govt.nz). Based on tenancy bonds lodged with MBIE for new private-sector tenancies. Bond counts reflect rental activity, not total rentals.
Rental Market
Area-wide rental market data for Christchurch City from MBIE tenancy bond lodgements. This shows the broader rental market, not a property-specific estimate.
| 1 year ago | $510/wk | +3.9% |
| 5 years ago | $390/wk | +35.9% |
Source: HUD Local Housing Statistics (data.govt.nz). Based on tenancy bonds lodged with MBIE. Median rents reflect new tenancies, not all current rents.
 Property Price Trends
Median sale prices across Christchurch City — shows the broader market trend, not a property-specific estimate.
| Median then | Change | Trend | |
|---|---|---|---|
| 1 year ago | $655,000 | +2.6% | Stable |
| 5 years ago | $455,000 | +47.7% | Strong Growth |
Source: HUD Local Housing Statistics (data.govt.nz). Median sale prices by territorial authority. Individual properties may sell above or below the median depending on condition, location, and features.
 Planning & Land Use
Zoning classification, heritage listings, and planning constraints that may affect what can be built or altered on or near this property.
District Plan Zoning
District Plan Zoning
Medium-density residential — townhouses, duplexes, and small apartment buildings are permitted alongside standalone houses.
Learn more: Christchurch City Council District Plan →
Source: Christchurch City Council District Plan operative zones layer. Indicative only — verify with the council before purchasing. Zoning governs permitted activities, height limits, setbacks, density, and subdivision rules.
 Land Contamination (HAIL)
HAIL (Hazardous Activities and Industries List) is a planning tool, not a contamination register. Hundreds of everyday activities qualify — service stations, drycleaners, printing shops, panel beaters, and cemeteries are all HAIL-listed activities. A property near a HAIL site has a plausible history of hazardous substance use; it has not been confirmed as contaminated, and most listed sites are never tested. A Phase 1 ESA is a desktop exercise — reviewing historical records and doing a site walkover — not a physical investigation. It typically costs $1,500–$4,000 and takes one to two weeks.
Air Quality
Air Quality
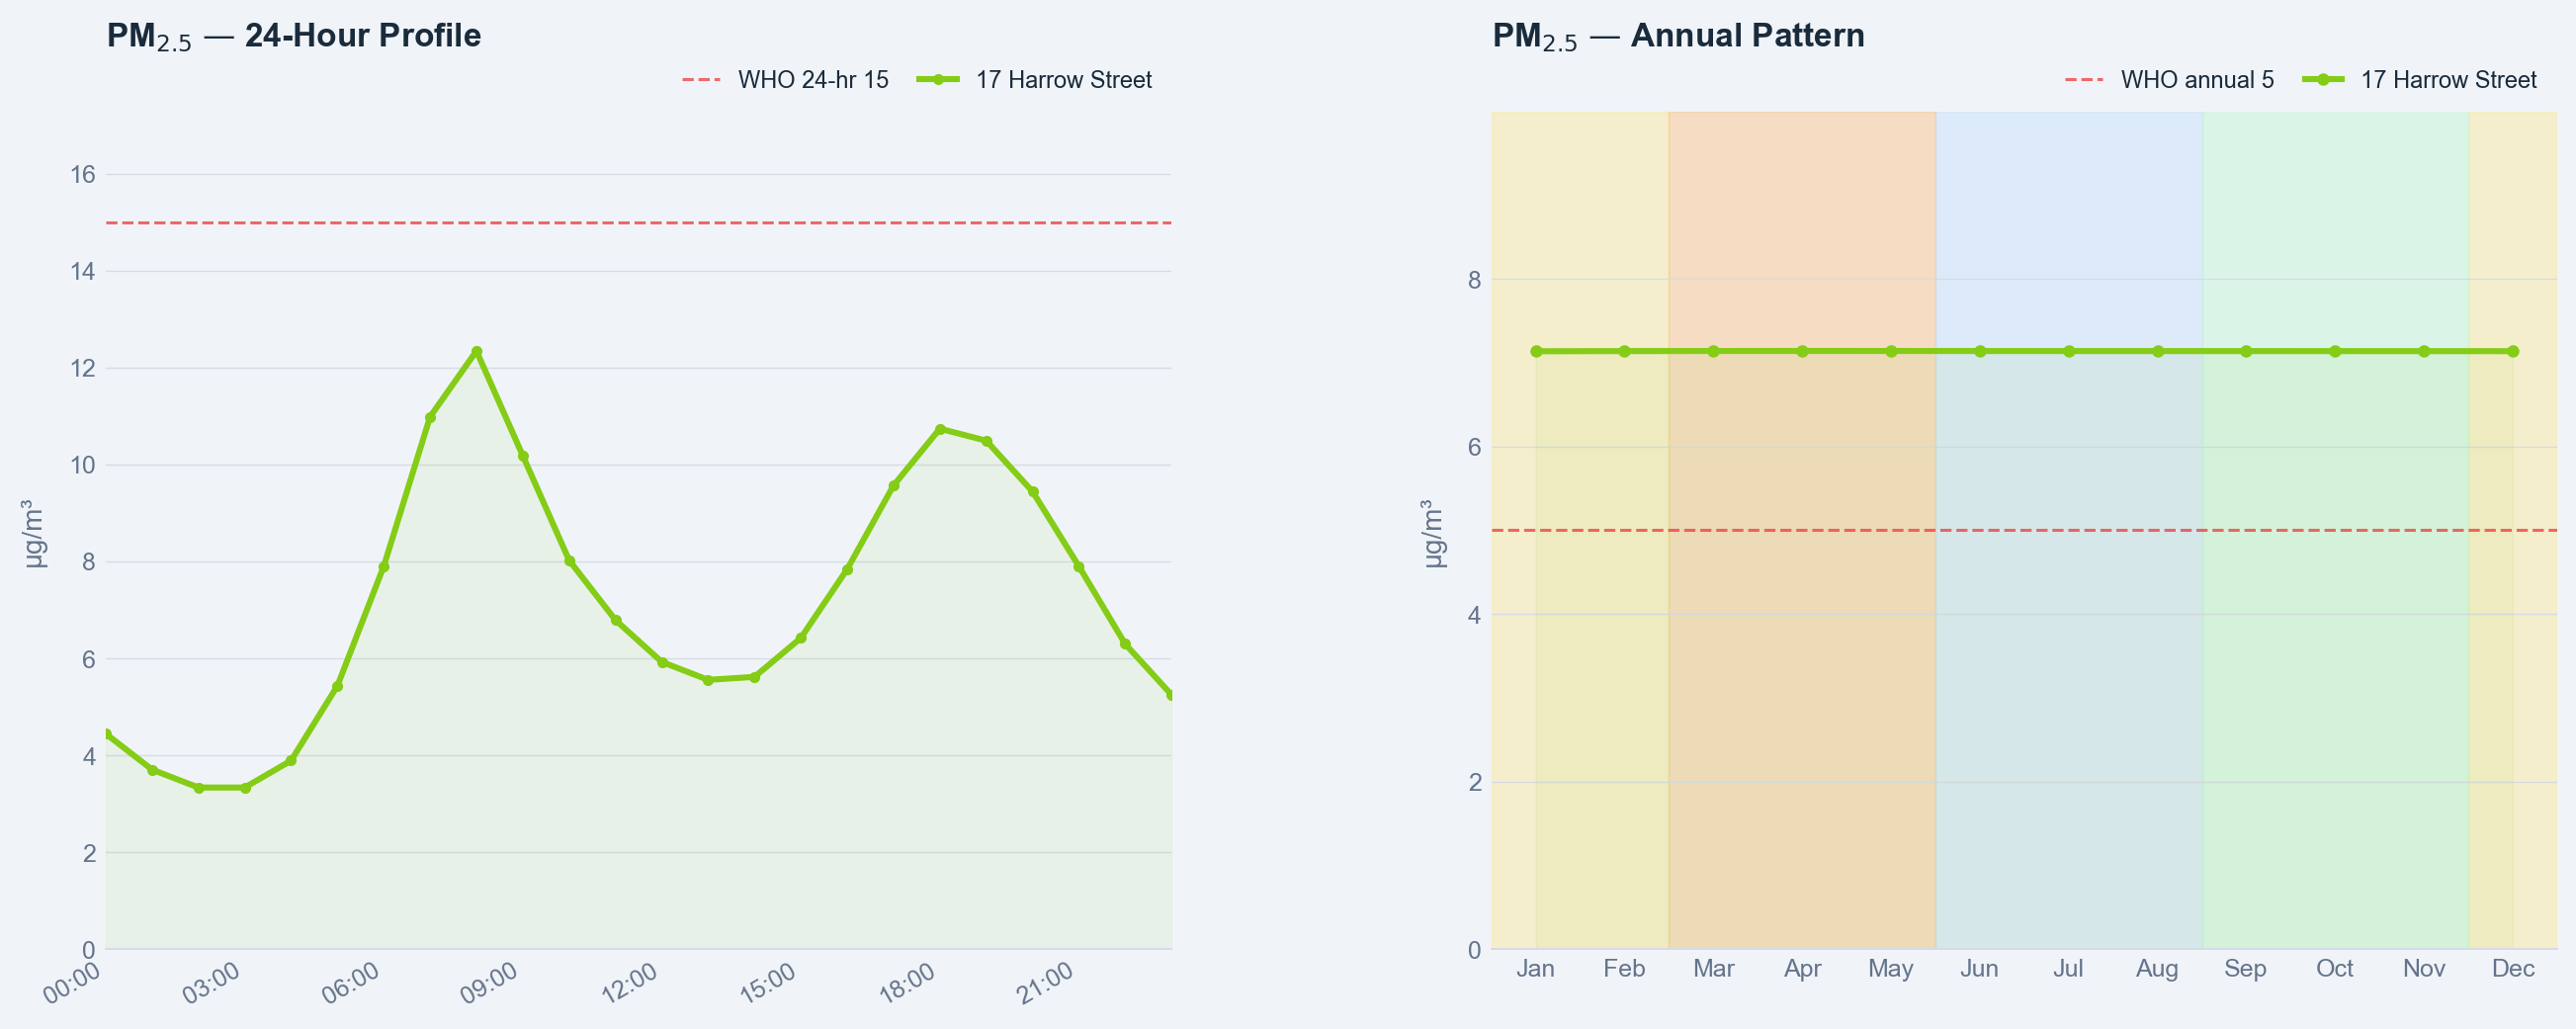
The annual PM2.5 concentration at 17 Harrow Street is 7.1 µg/m³, which exceeds the WHO guideline of 5.0 µg/m³ by approximately 42 percent. However, this level remains marginally above the Christchurch city average of 7.5 µg/m³ and well within New Zealand's national air quality standards, as the country has no binding annual PM2.5 limit. The property's air quality score of 8.6/10 reflects overall good conditions despite this minor WHO exceedance.
Seasonal monitoring reveals no variation between winter and summer mean PM2.5 concentrations, both recorded at 7.1 µg/m³, suggesting consistent year-round pollution sources rather than winter-dominant heating-related pollution. The worst pollution day on 1 July 2023 (mid-winter) indicates that episodic events, rather than seasonal baseline shifts, drive peak exposure. For residents, this pattern suggests that air quality remains relatively stable across seasons, though occasional poor-air-quality days warrant attention, particularly during winter months when inversions may trap pollutants.
| Pollutant | What it is / where it comes from | WHO Guideline |
|---|---|---|
| PM2.5 | Fine combustion particles (≤2.5 µm, ~30× thinner than a hair). Bypass the body's natural filters and reach the lungs and bloodstream — linked to heart disease, stroke, lung cancer. | WHO 5 µg/m³ (annual) |
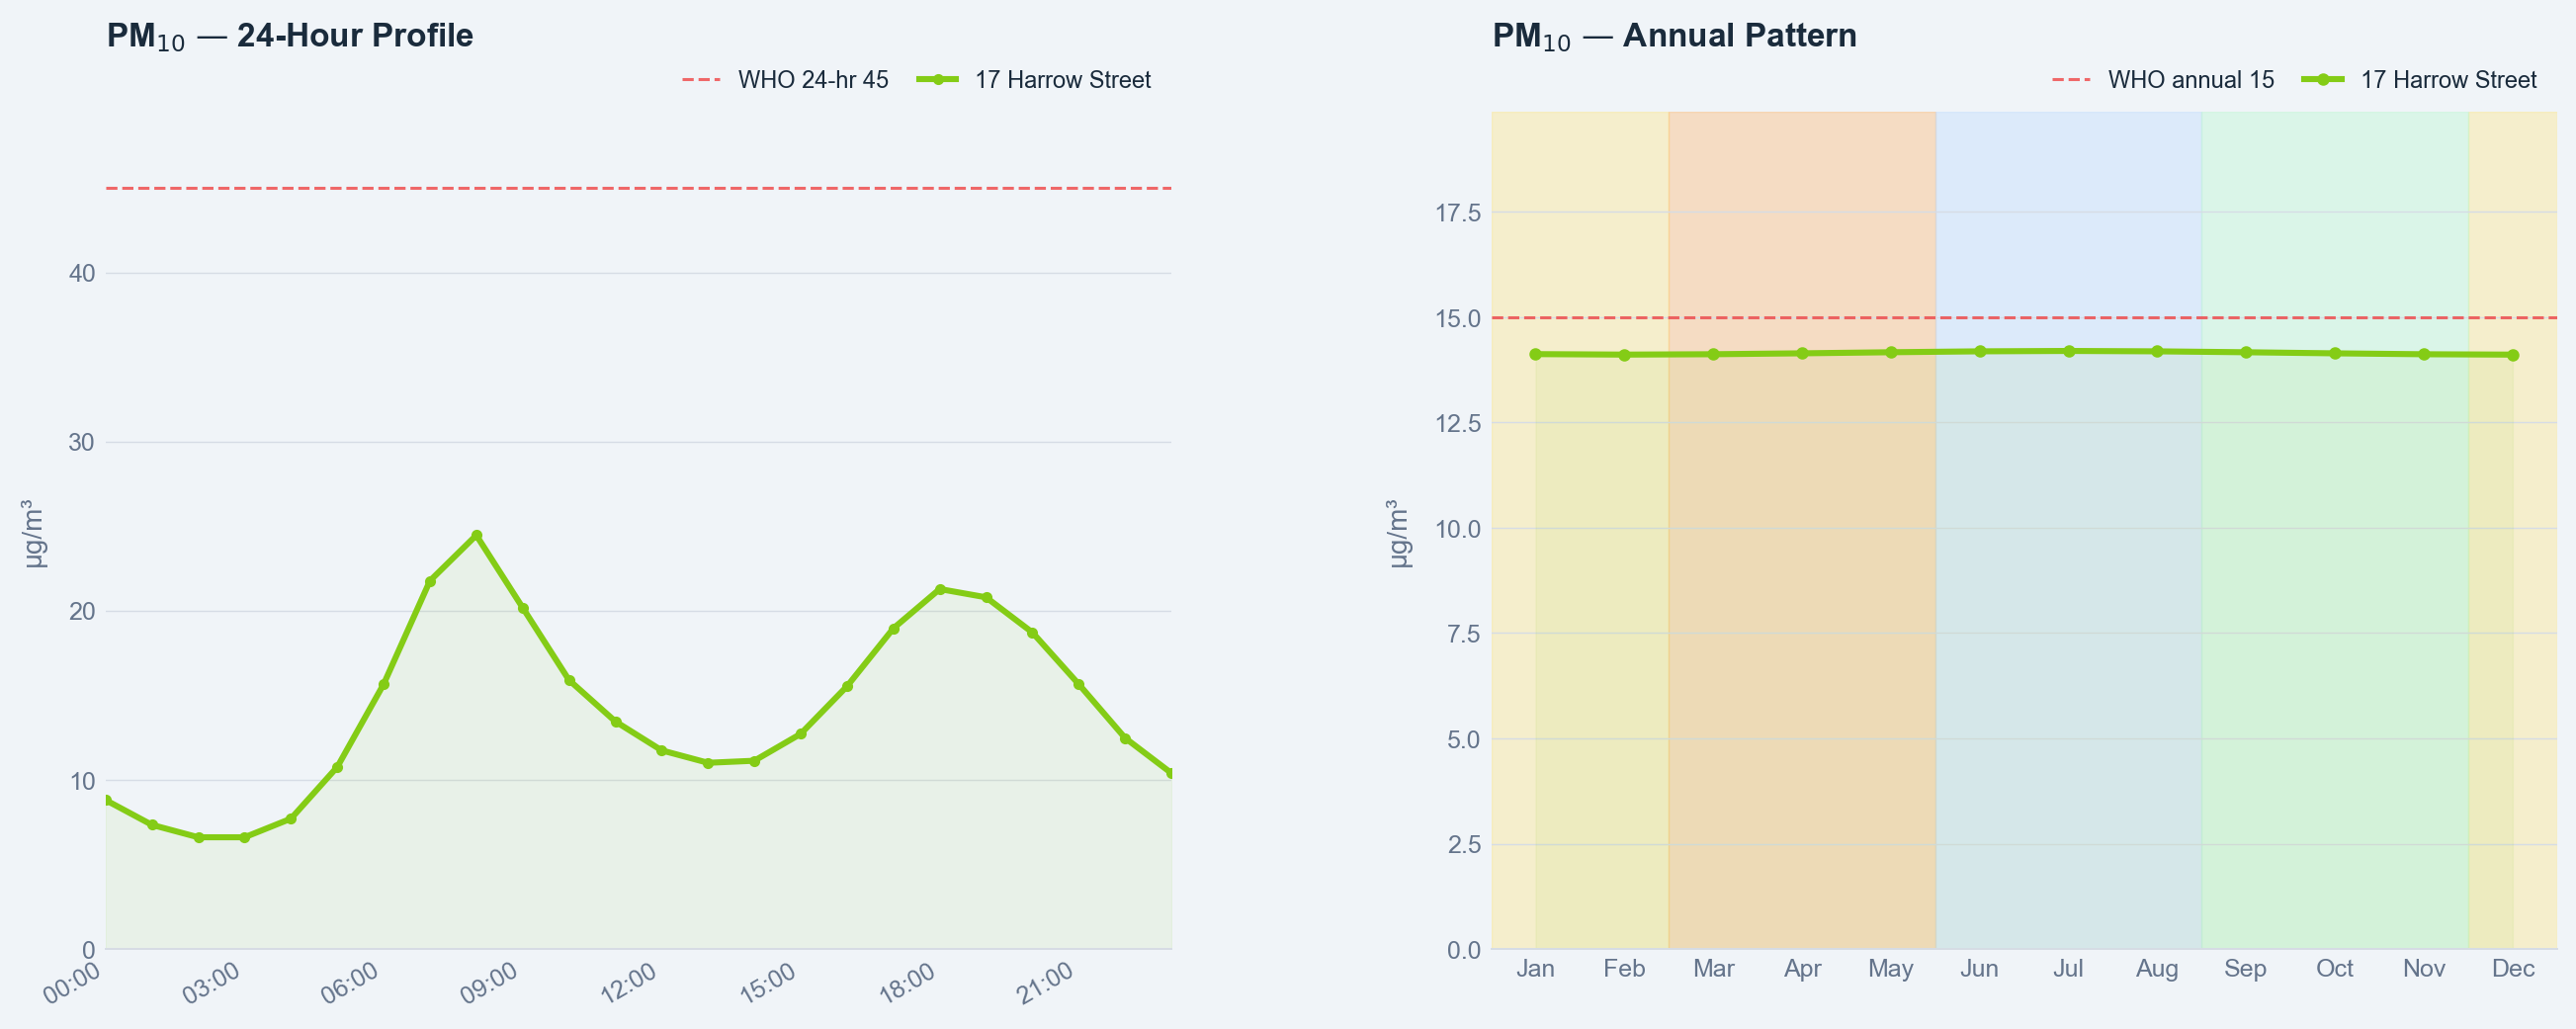
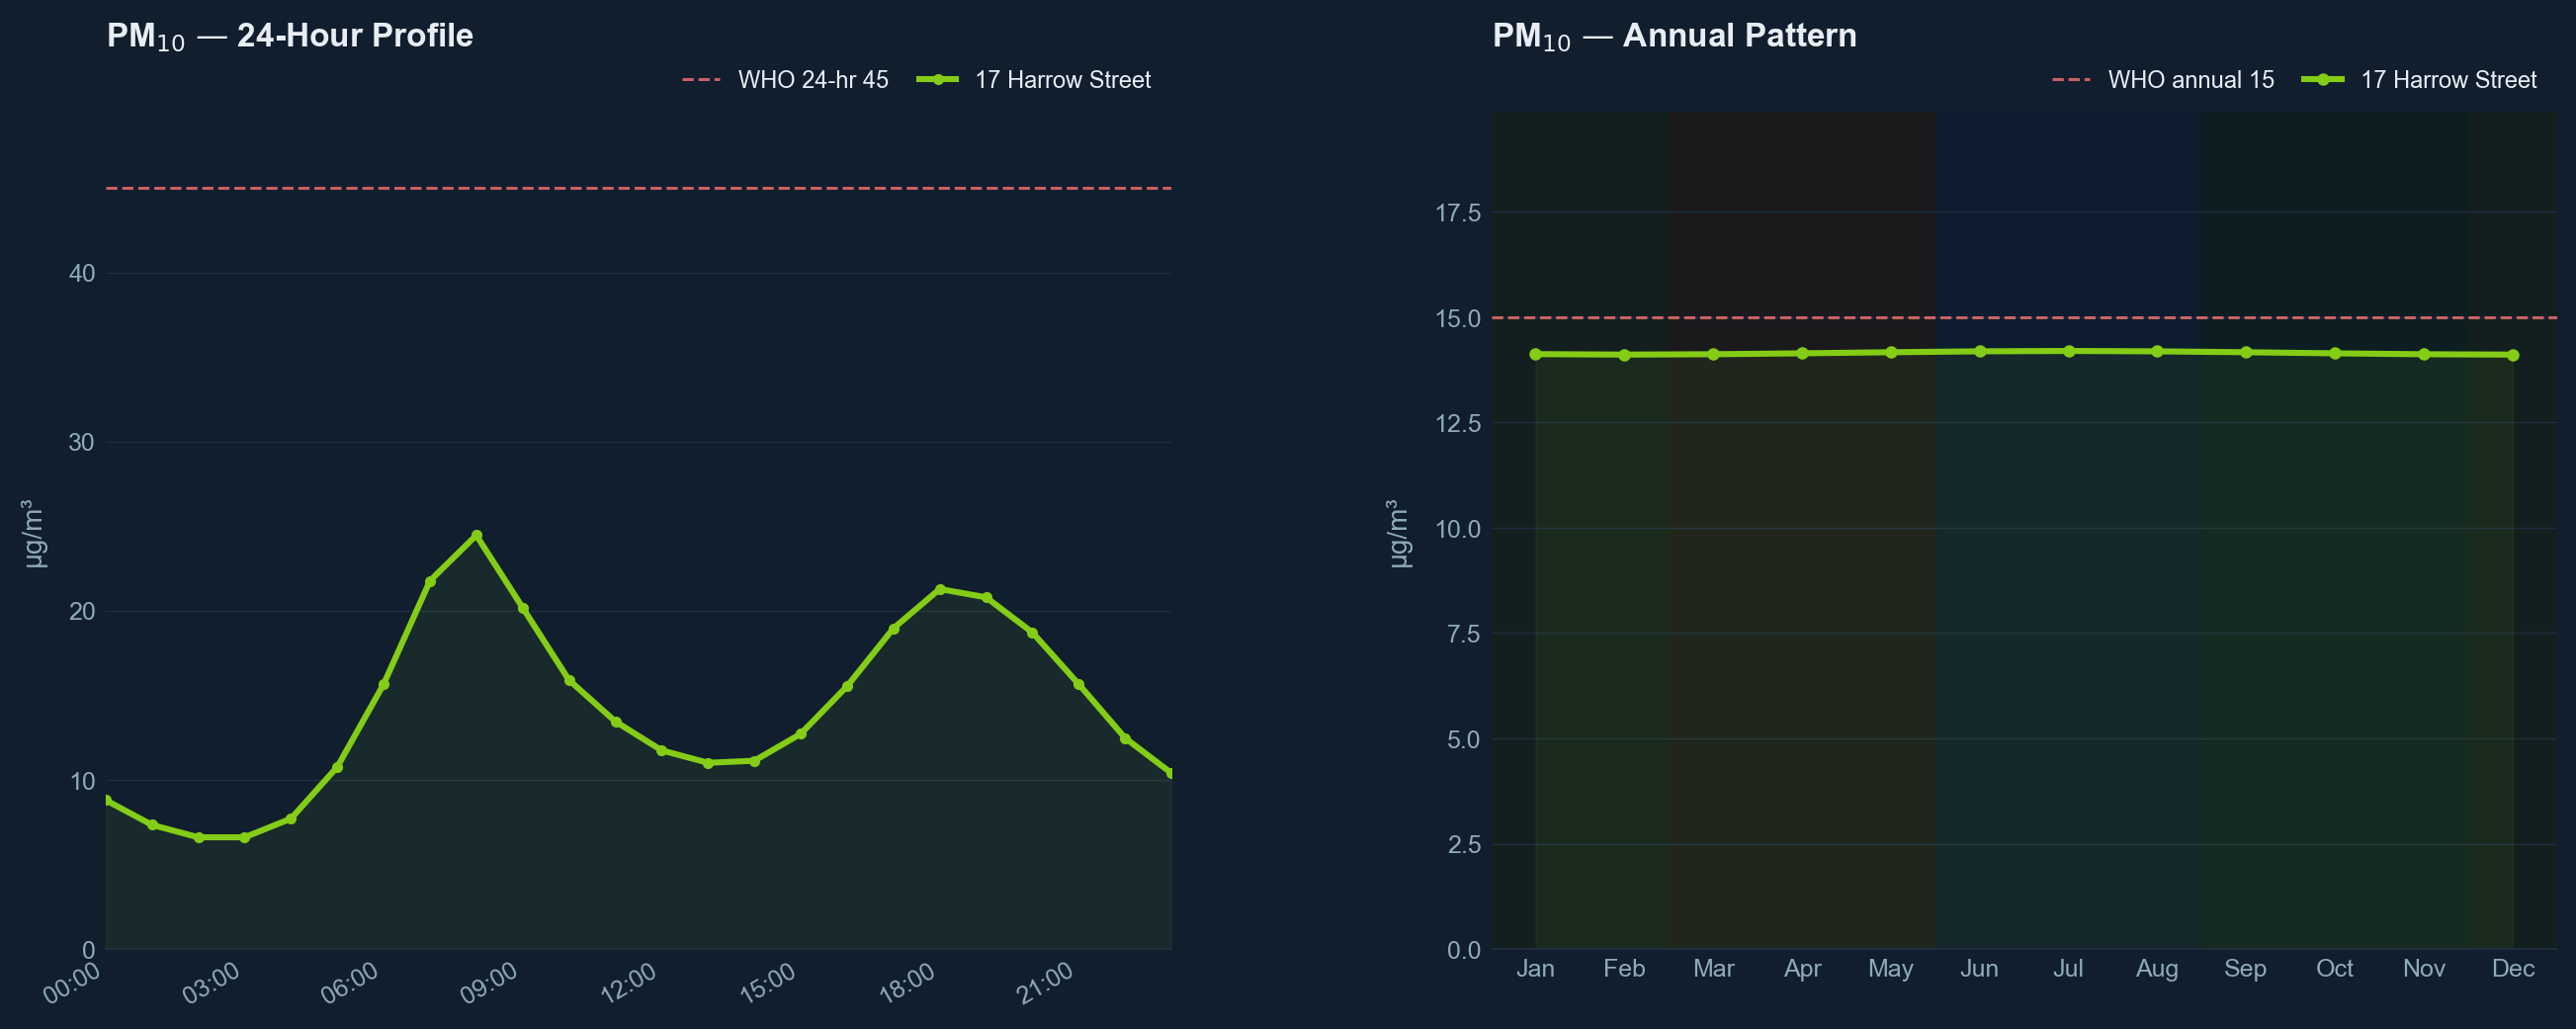
| PM10 | Coarser particles (≤10 µm) — road dust, pollen, construction. Inhaled into the nose and throat. | WHO 15 µg/m³ (annual) |
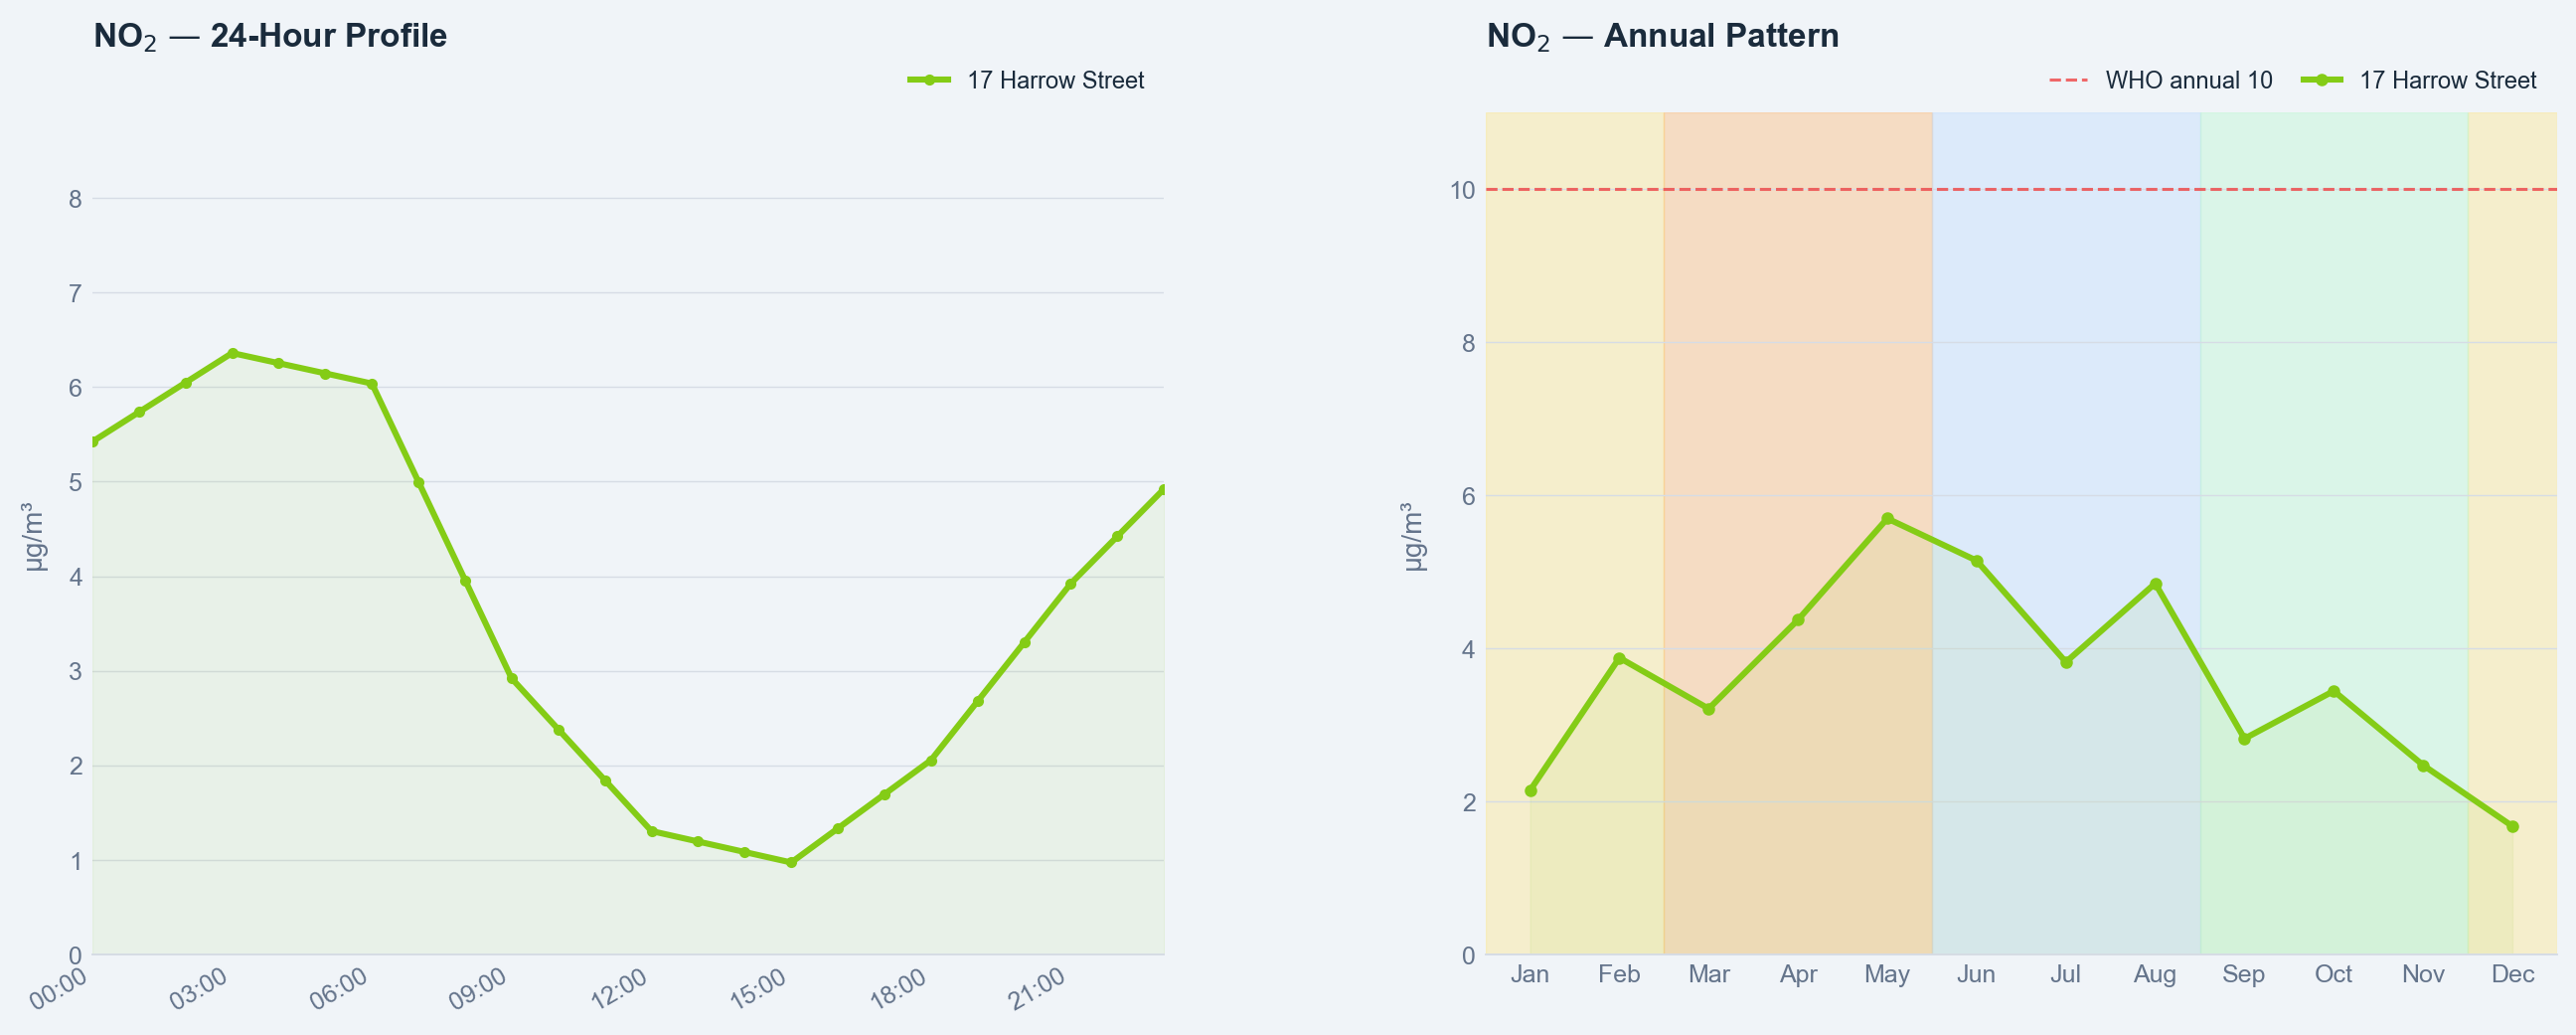
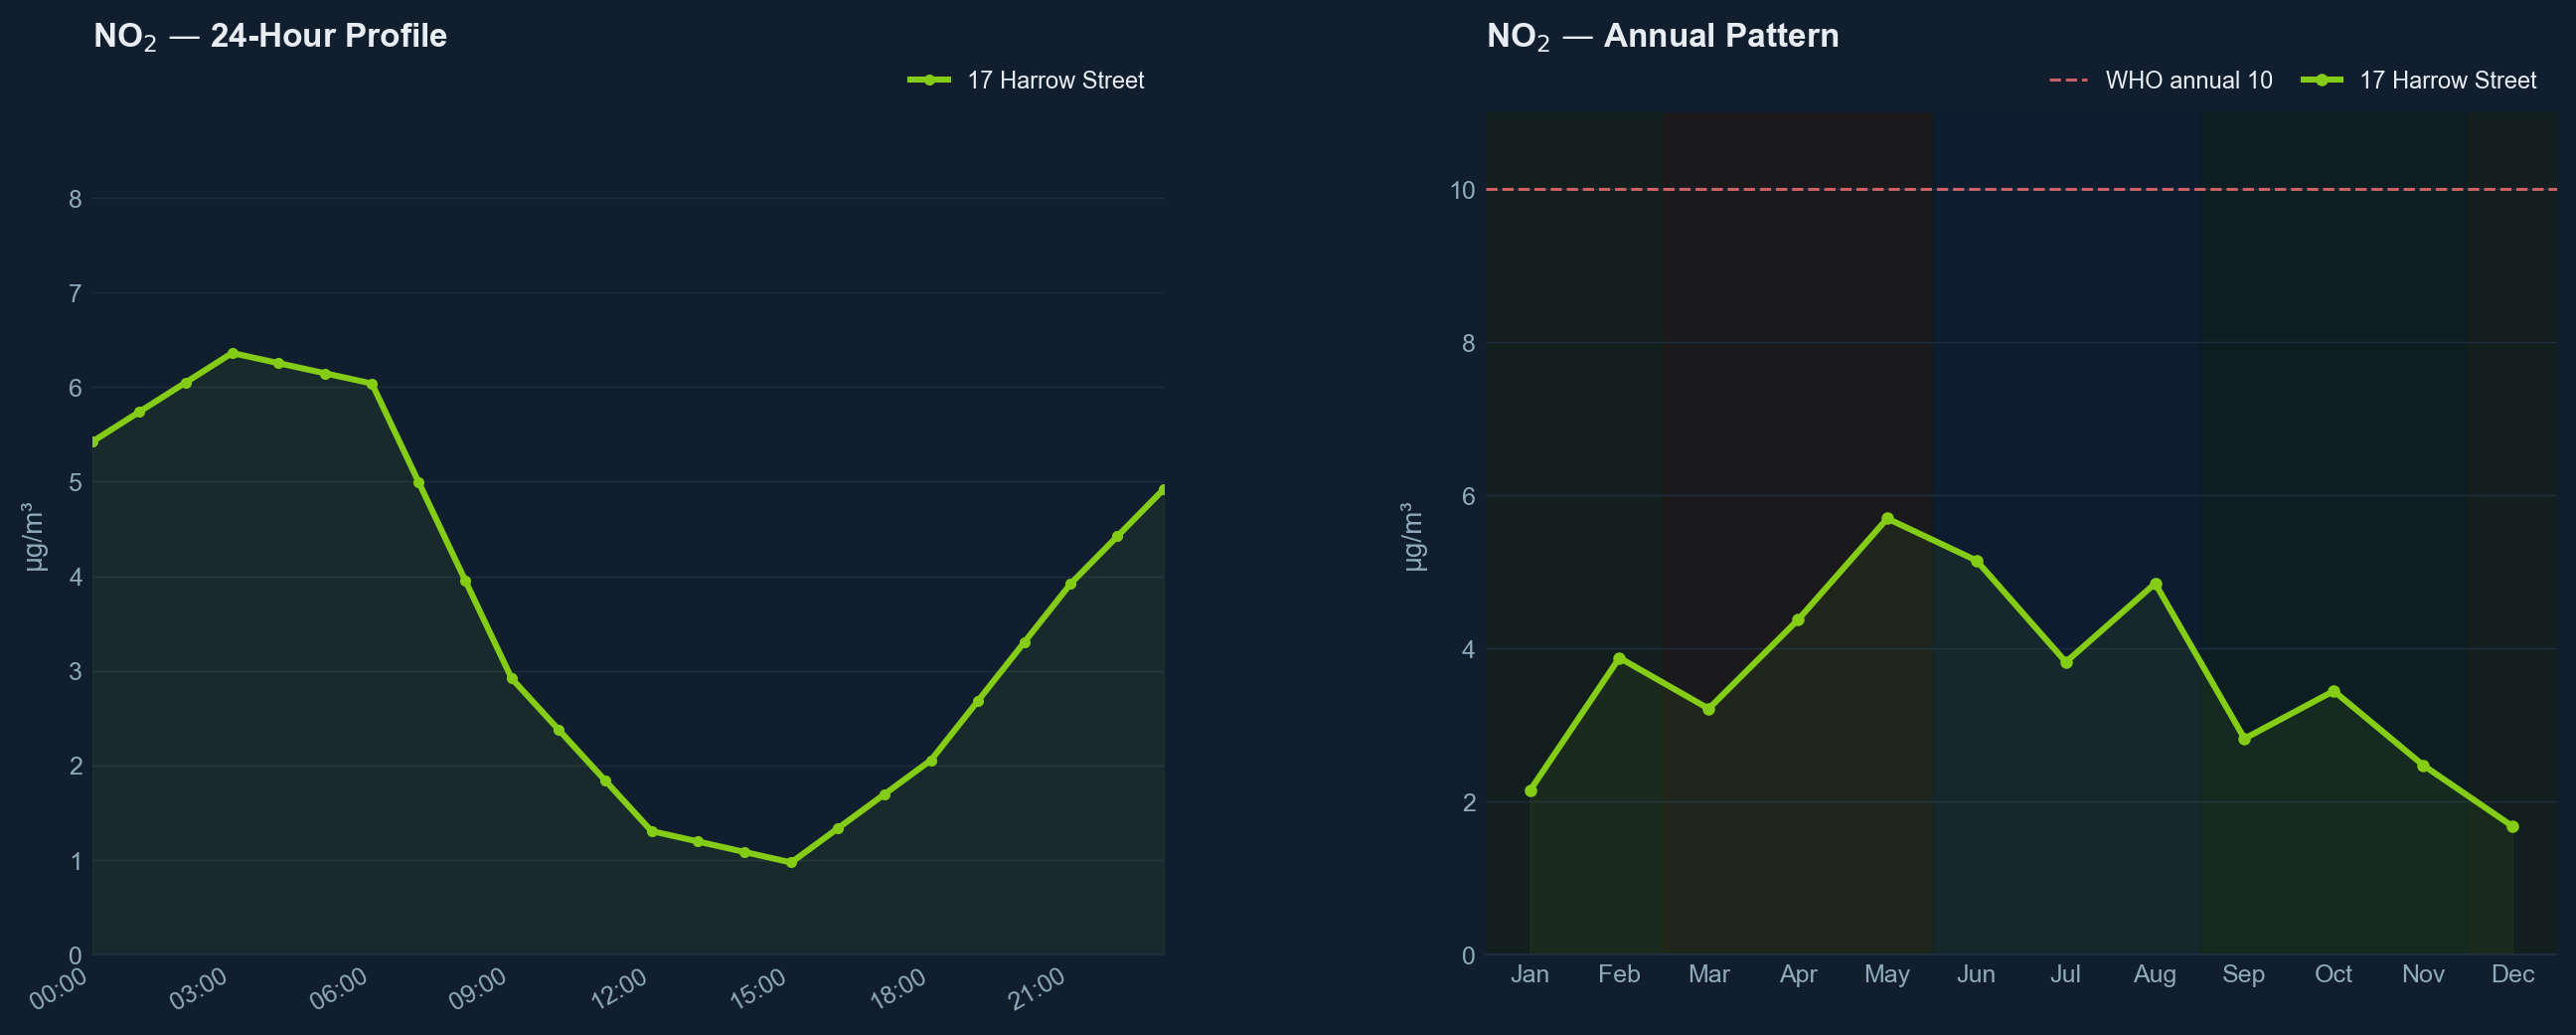
| NO₂ | Reddish-brown gas from vehicle engines and combustion. Irritates airways and worsens asthma, especially in children. | WHO 10 µg/m³ (annual) |
| O₃ | Ground-level ozone, formed when NOₓ and VOCs react in sunlight. Aggravates asthma and COPD; highest on sunny, still afternoons. | WHO 100 µg/m³ (8-hr) |
| SO₂ | Pungent gas from coal/diesel combustion, industrial processes, and geothermal activity. Triggers asthma and irritates airways. | WHO 40 µg/m³ (24-hr) |
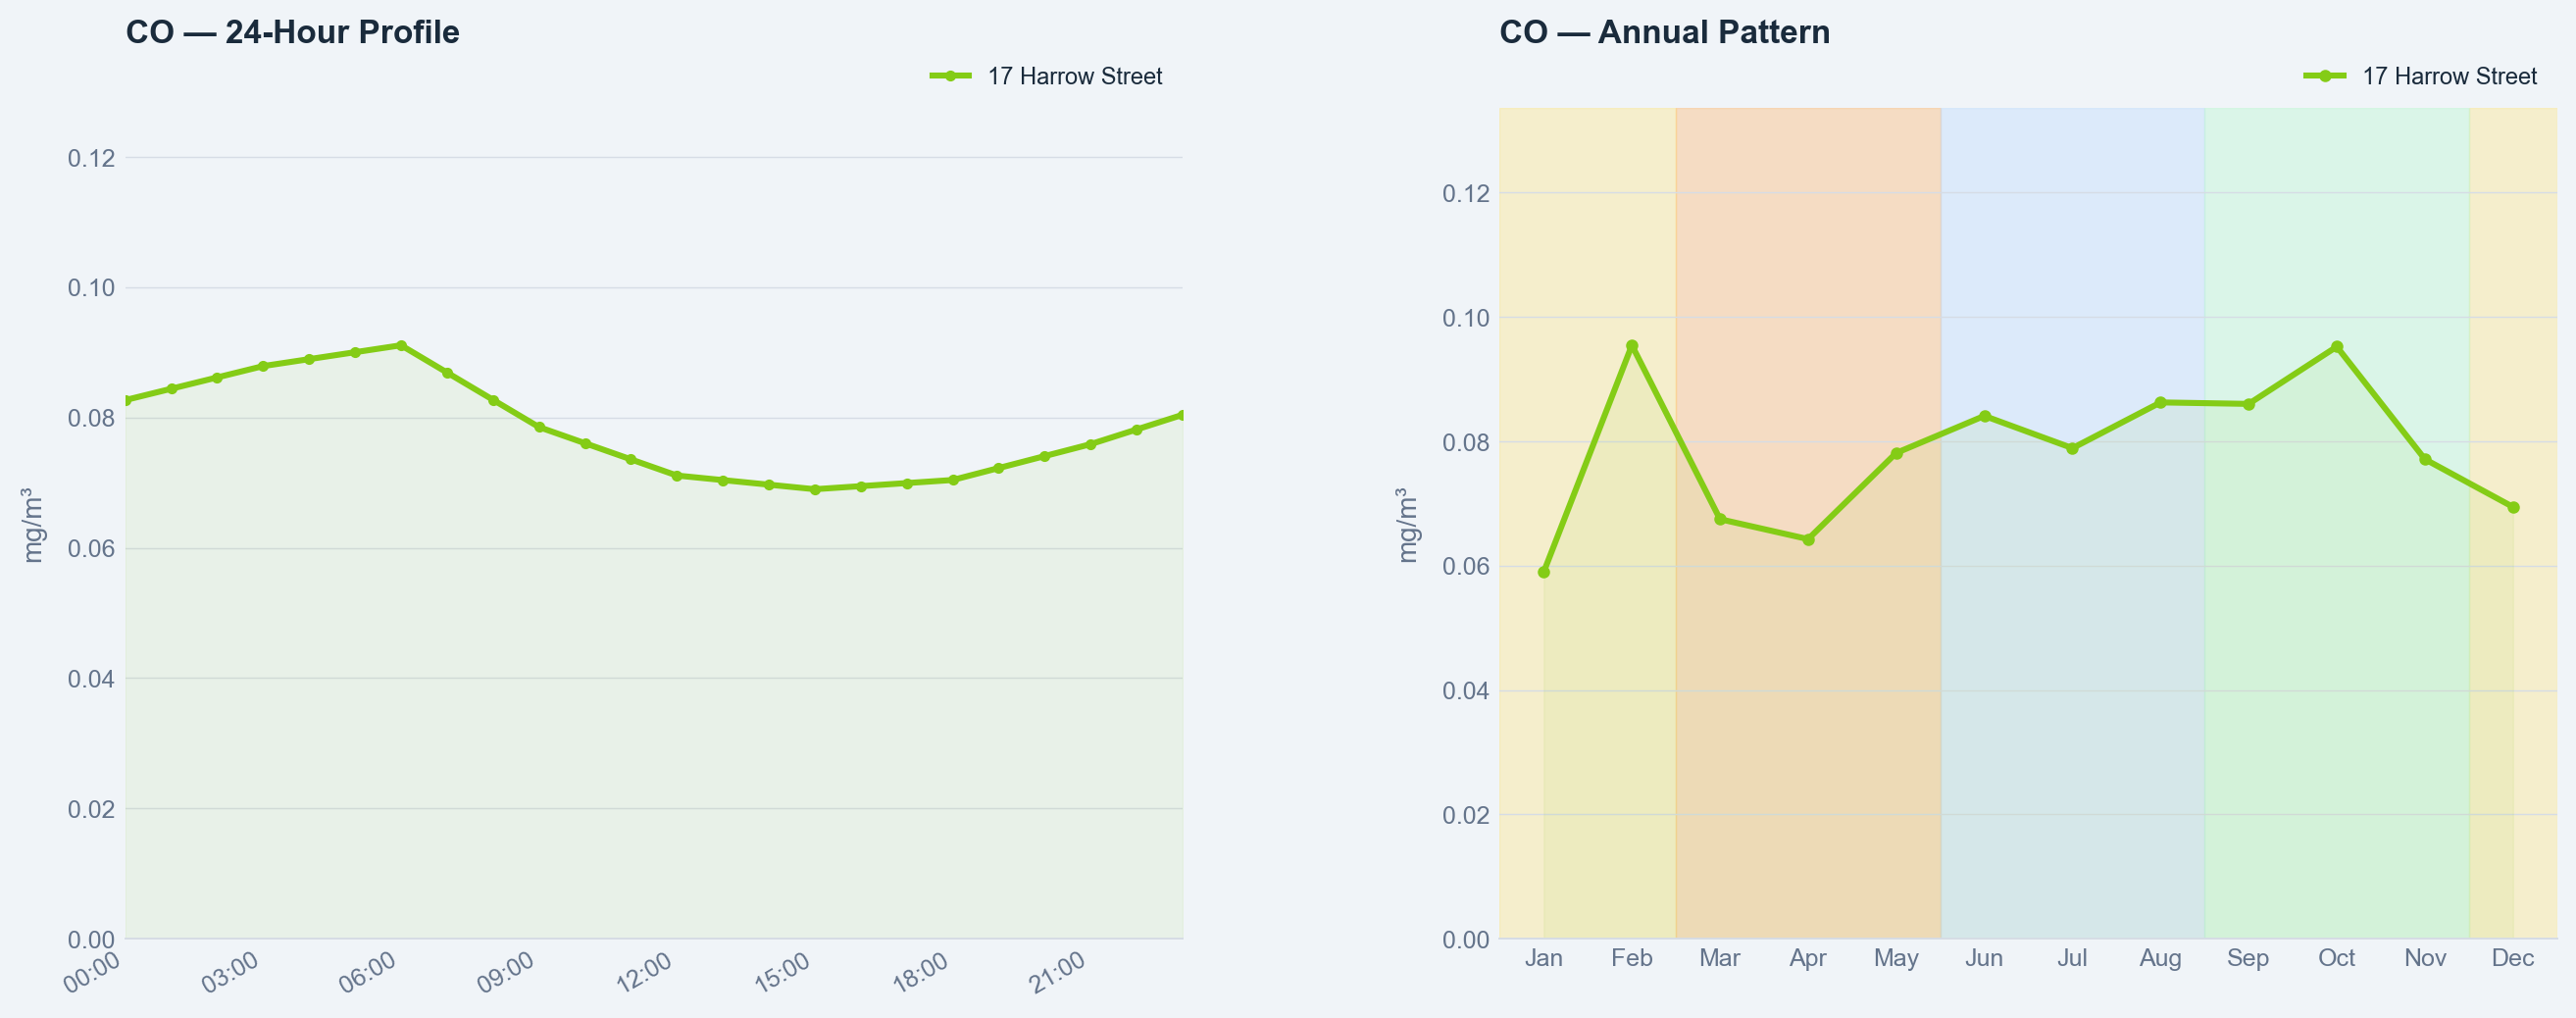
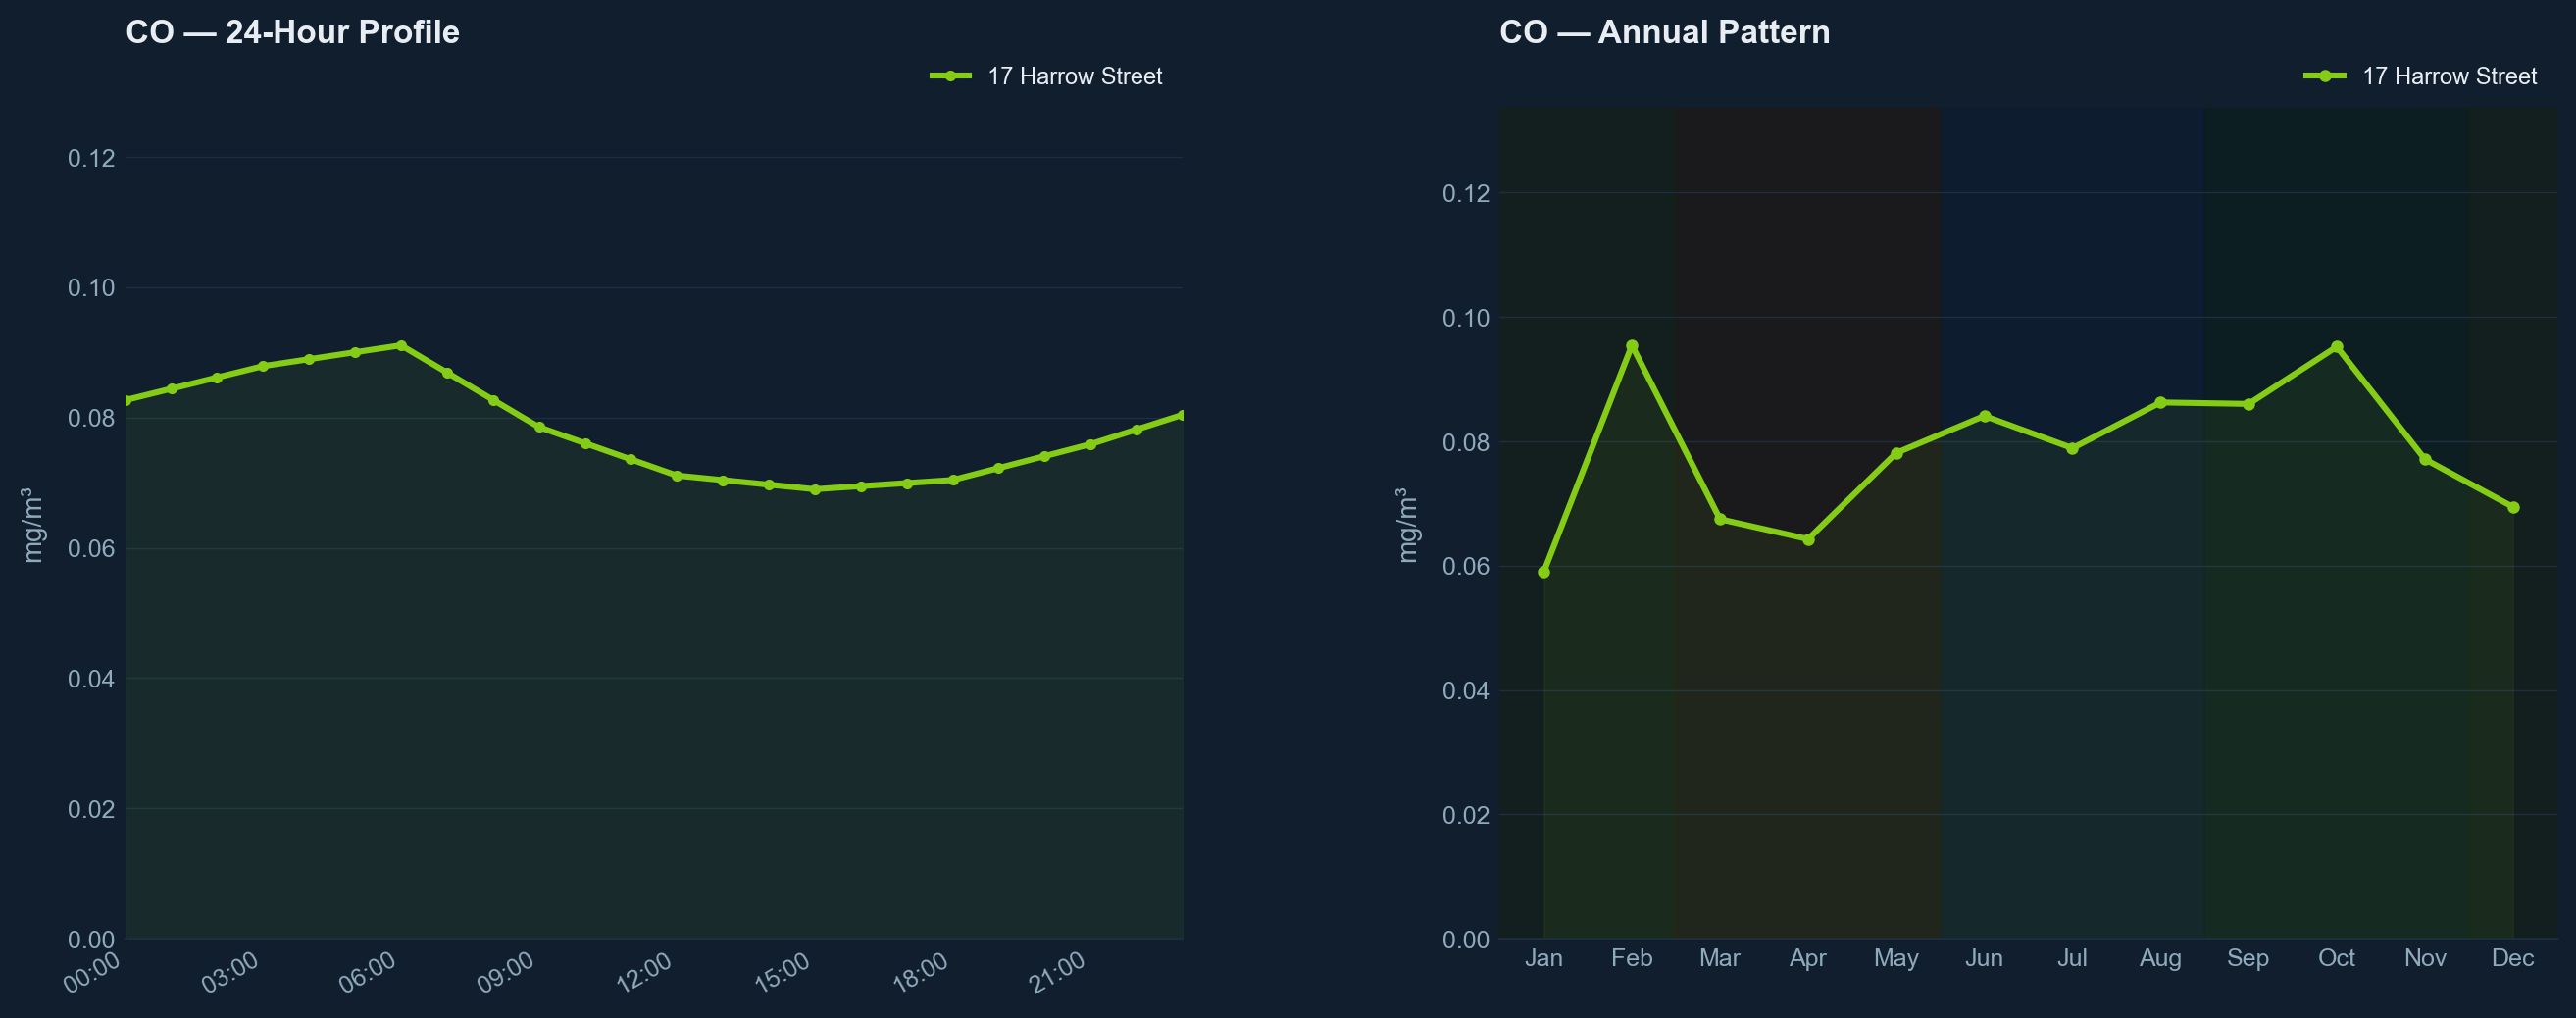
| CO | Odourless gas from incomplete combustion (vehicles, wood burners). Reduces blood's oxygen-carrying capacity at high levels; NZ outdoor levels are usually safe. | WHO 4,000 µg/m³ (24-hr) |
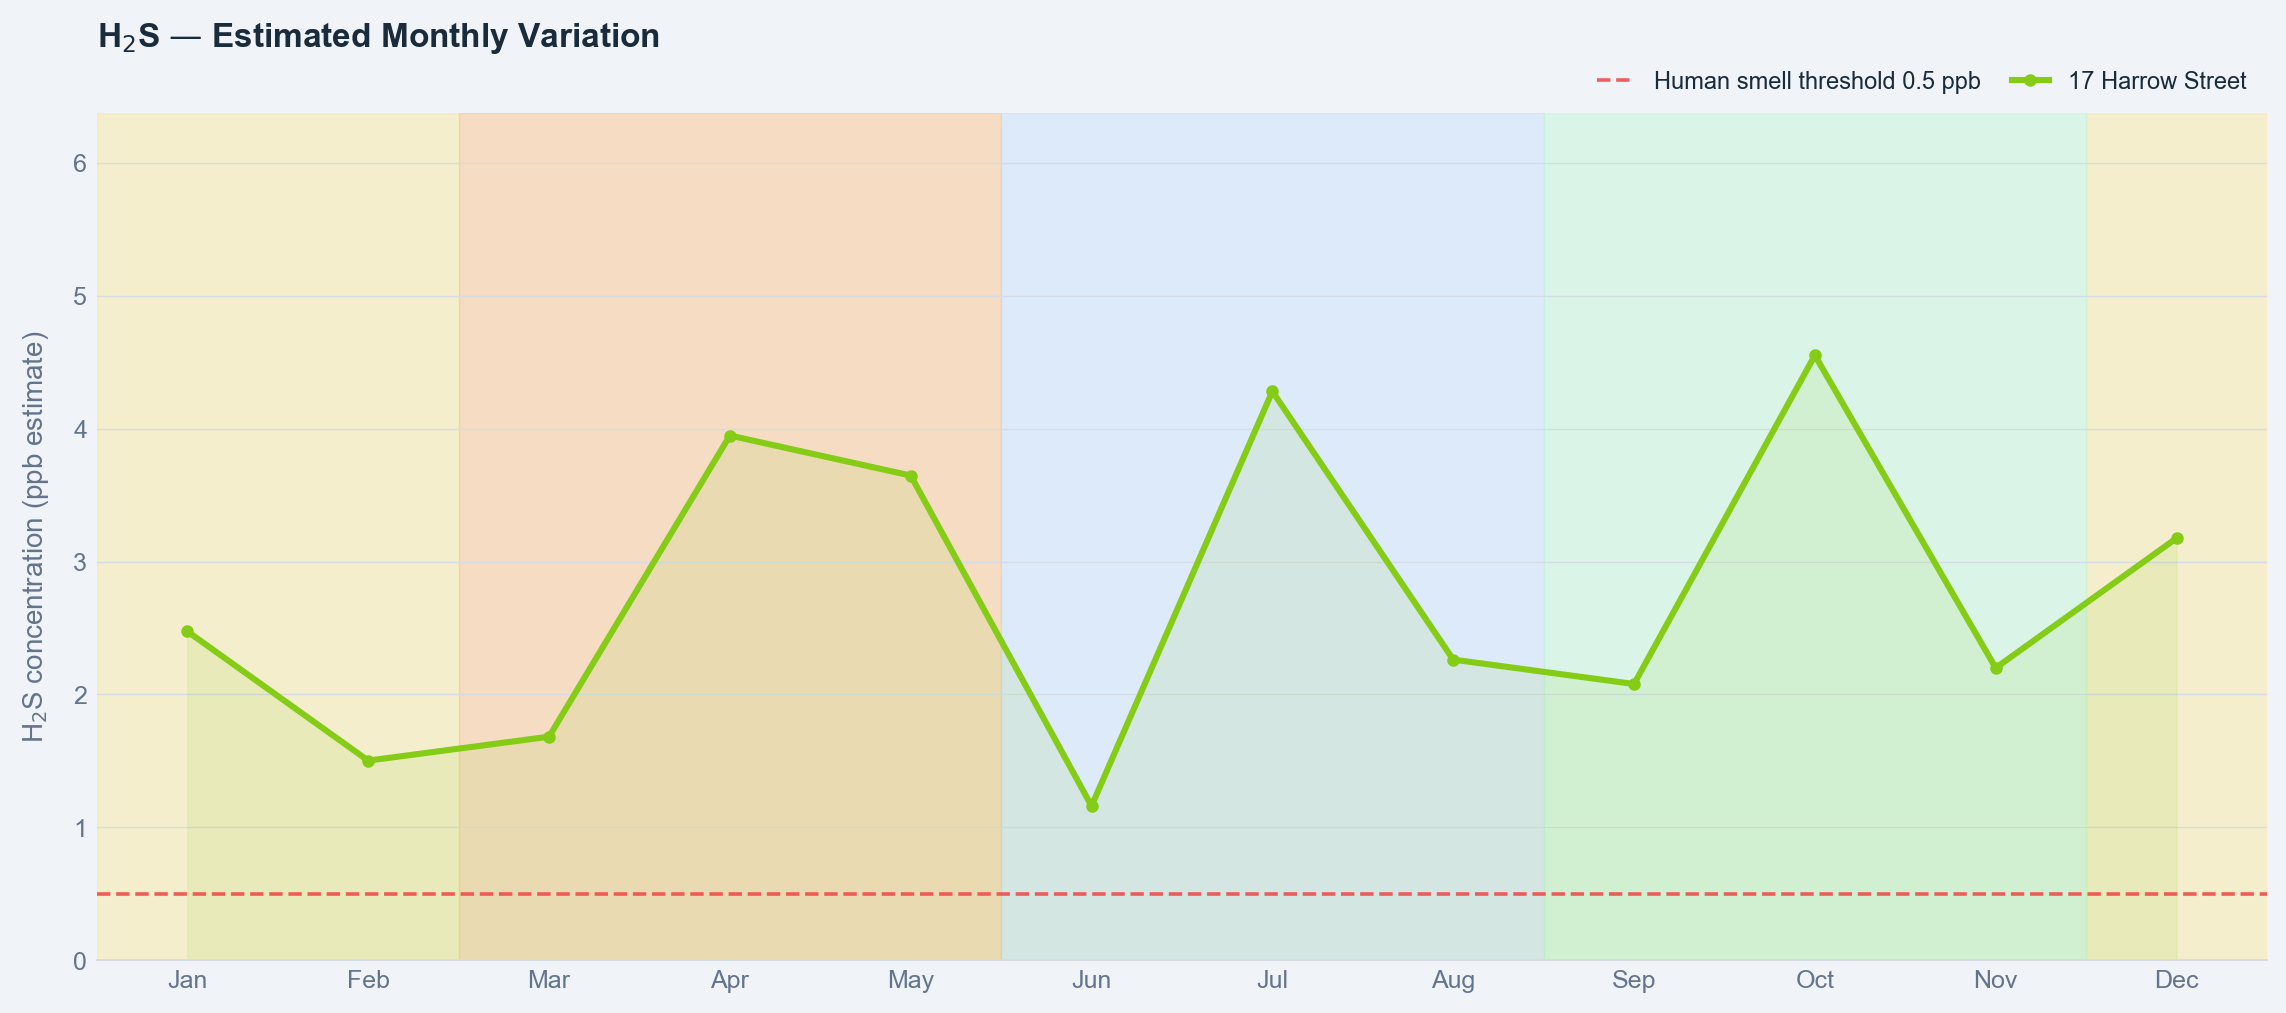
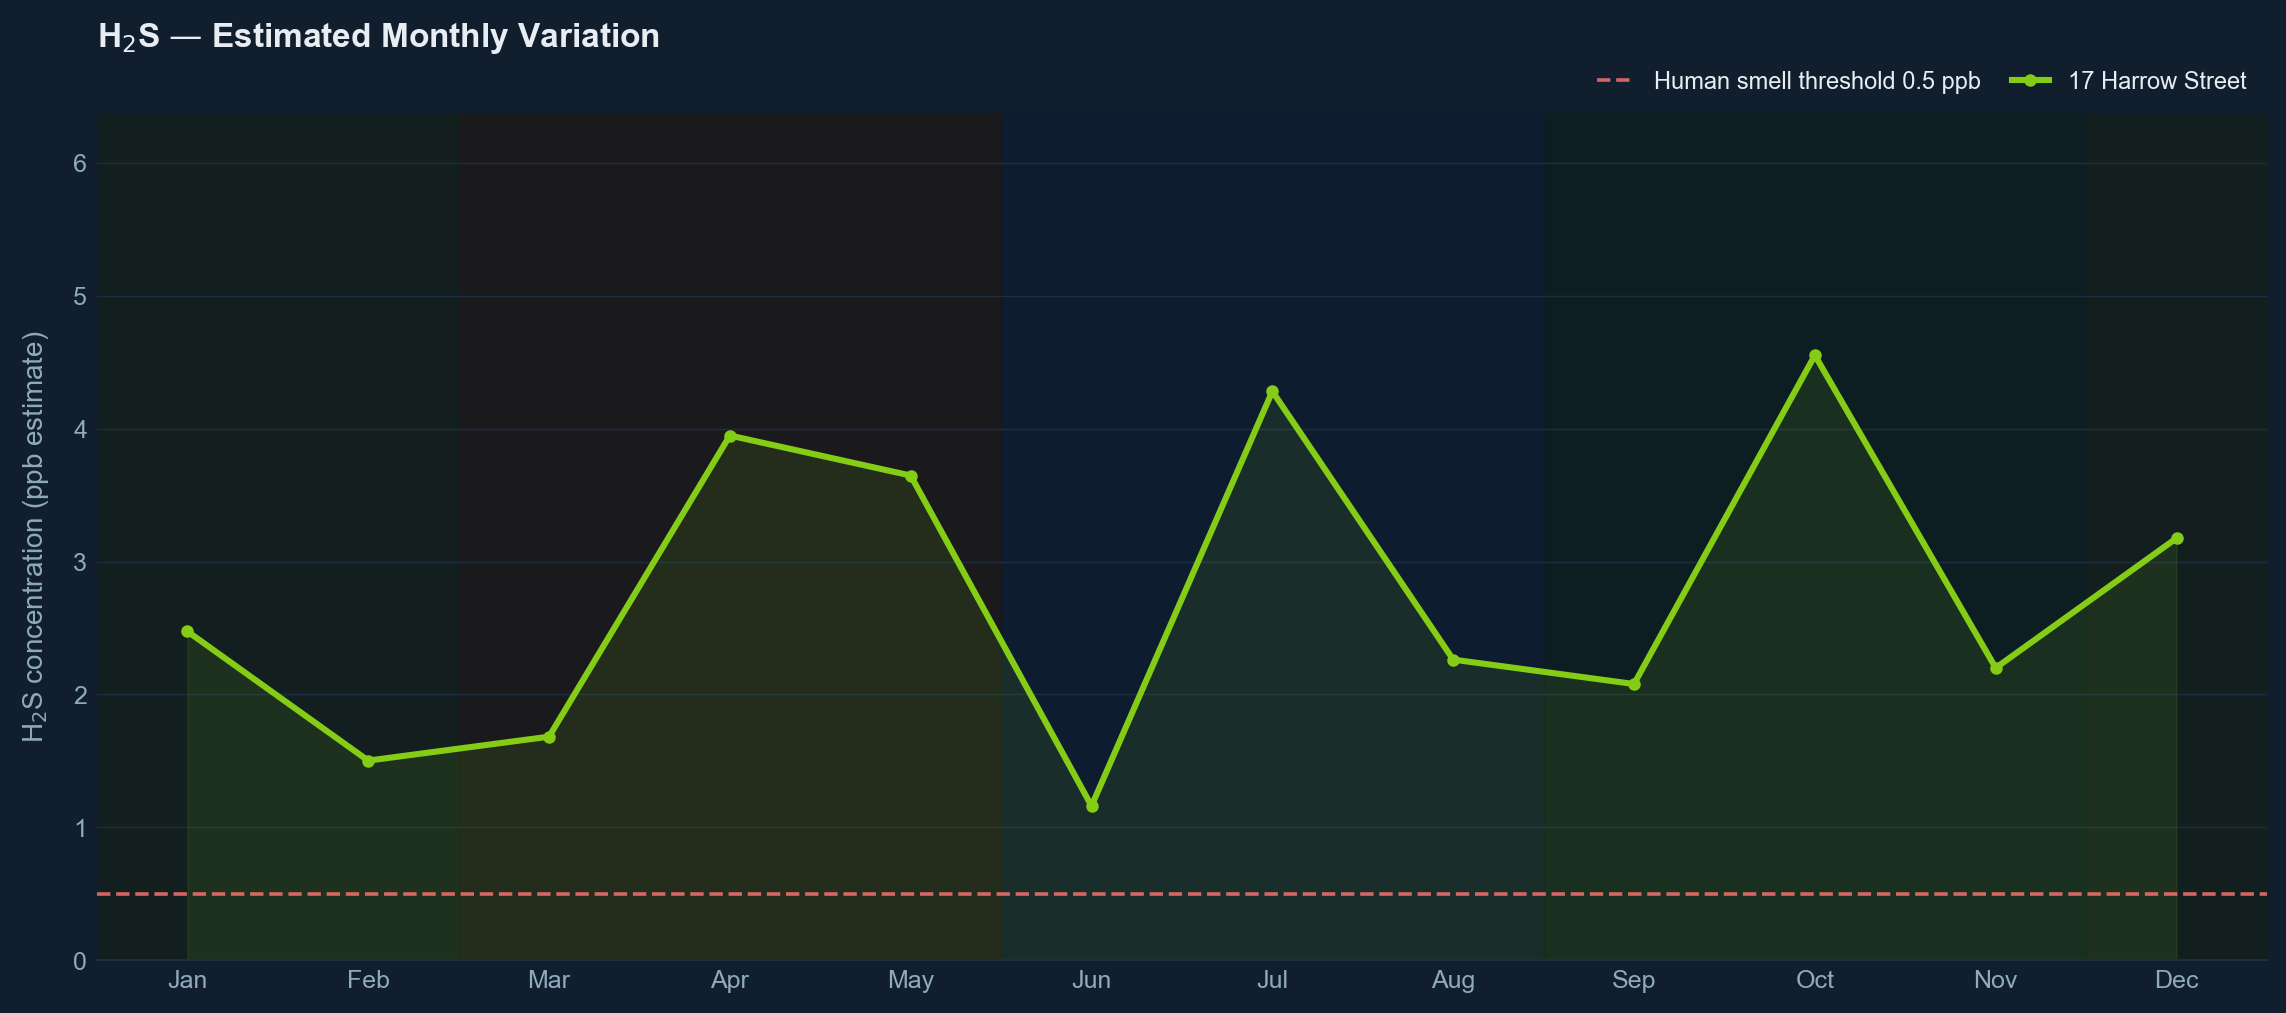
| H₂S | Rotten-egg smell from wastewater plants, composting, rendering, and geothermal activity. Not directly toxic at ambient outdoor levels, but persistent odour disrupts sleep and wellbeing. | WHO 7 µg/m³ (30-min, odour) |
Predictions from a deep learning model trained on LAWA (Land Air Water Aotearoa) ambient air monitoring station data for this region. Meteorological inputs: ERA5 reanalysis (Open-Meteo, 2023). Spatial features: NZTA/OpenStreetMap road network, LINZ topographic data, Stats NZ land use. Values represent the modelled annual and seasonal mean at the nearest 100 m grid cell to the property. Model year: 2023.
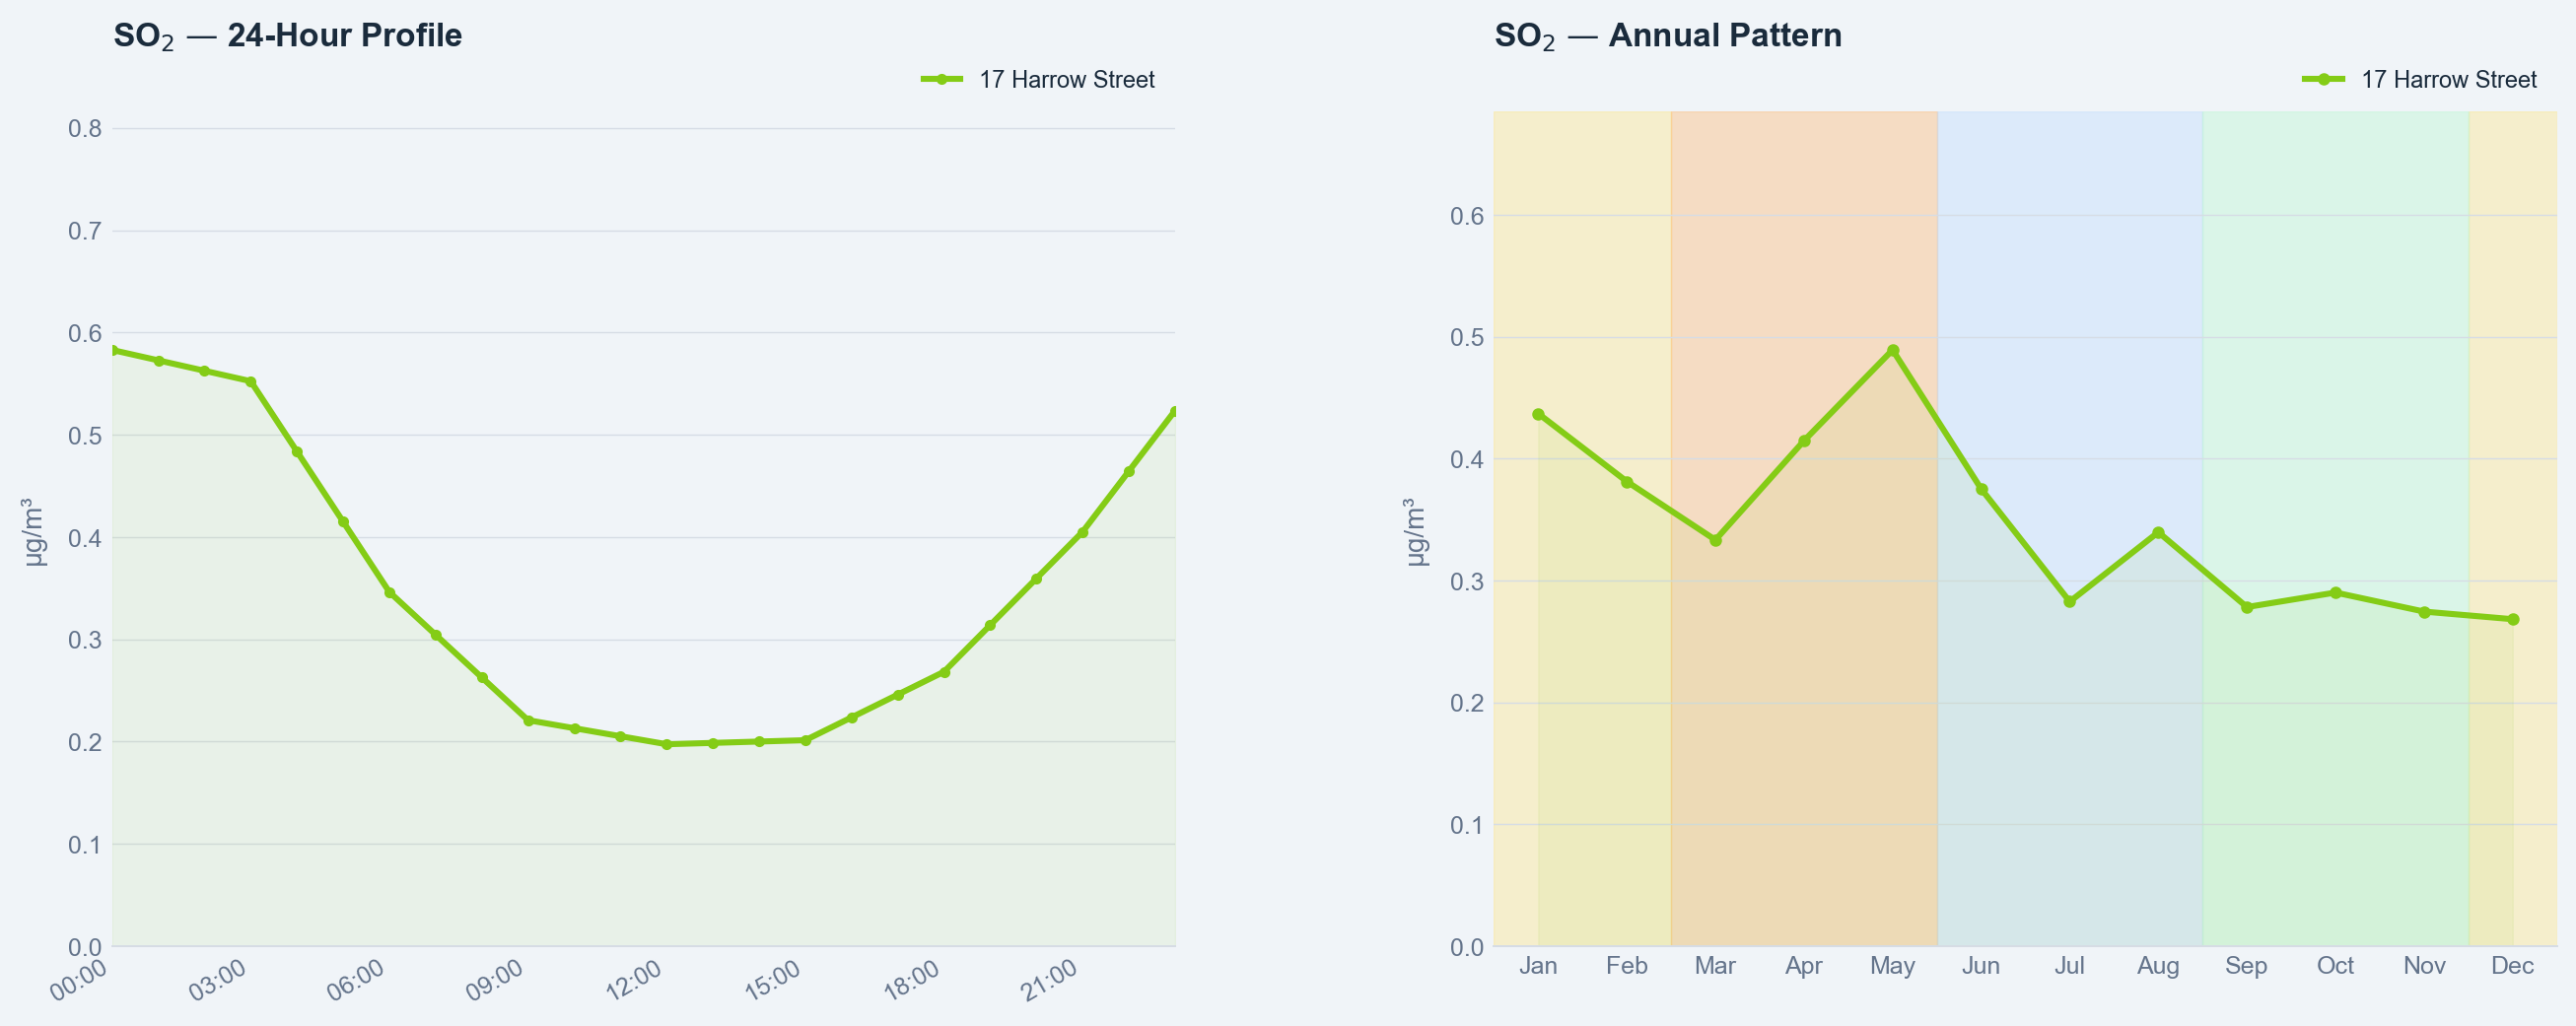
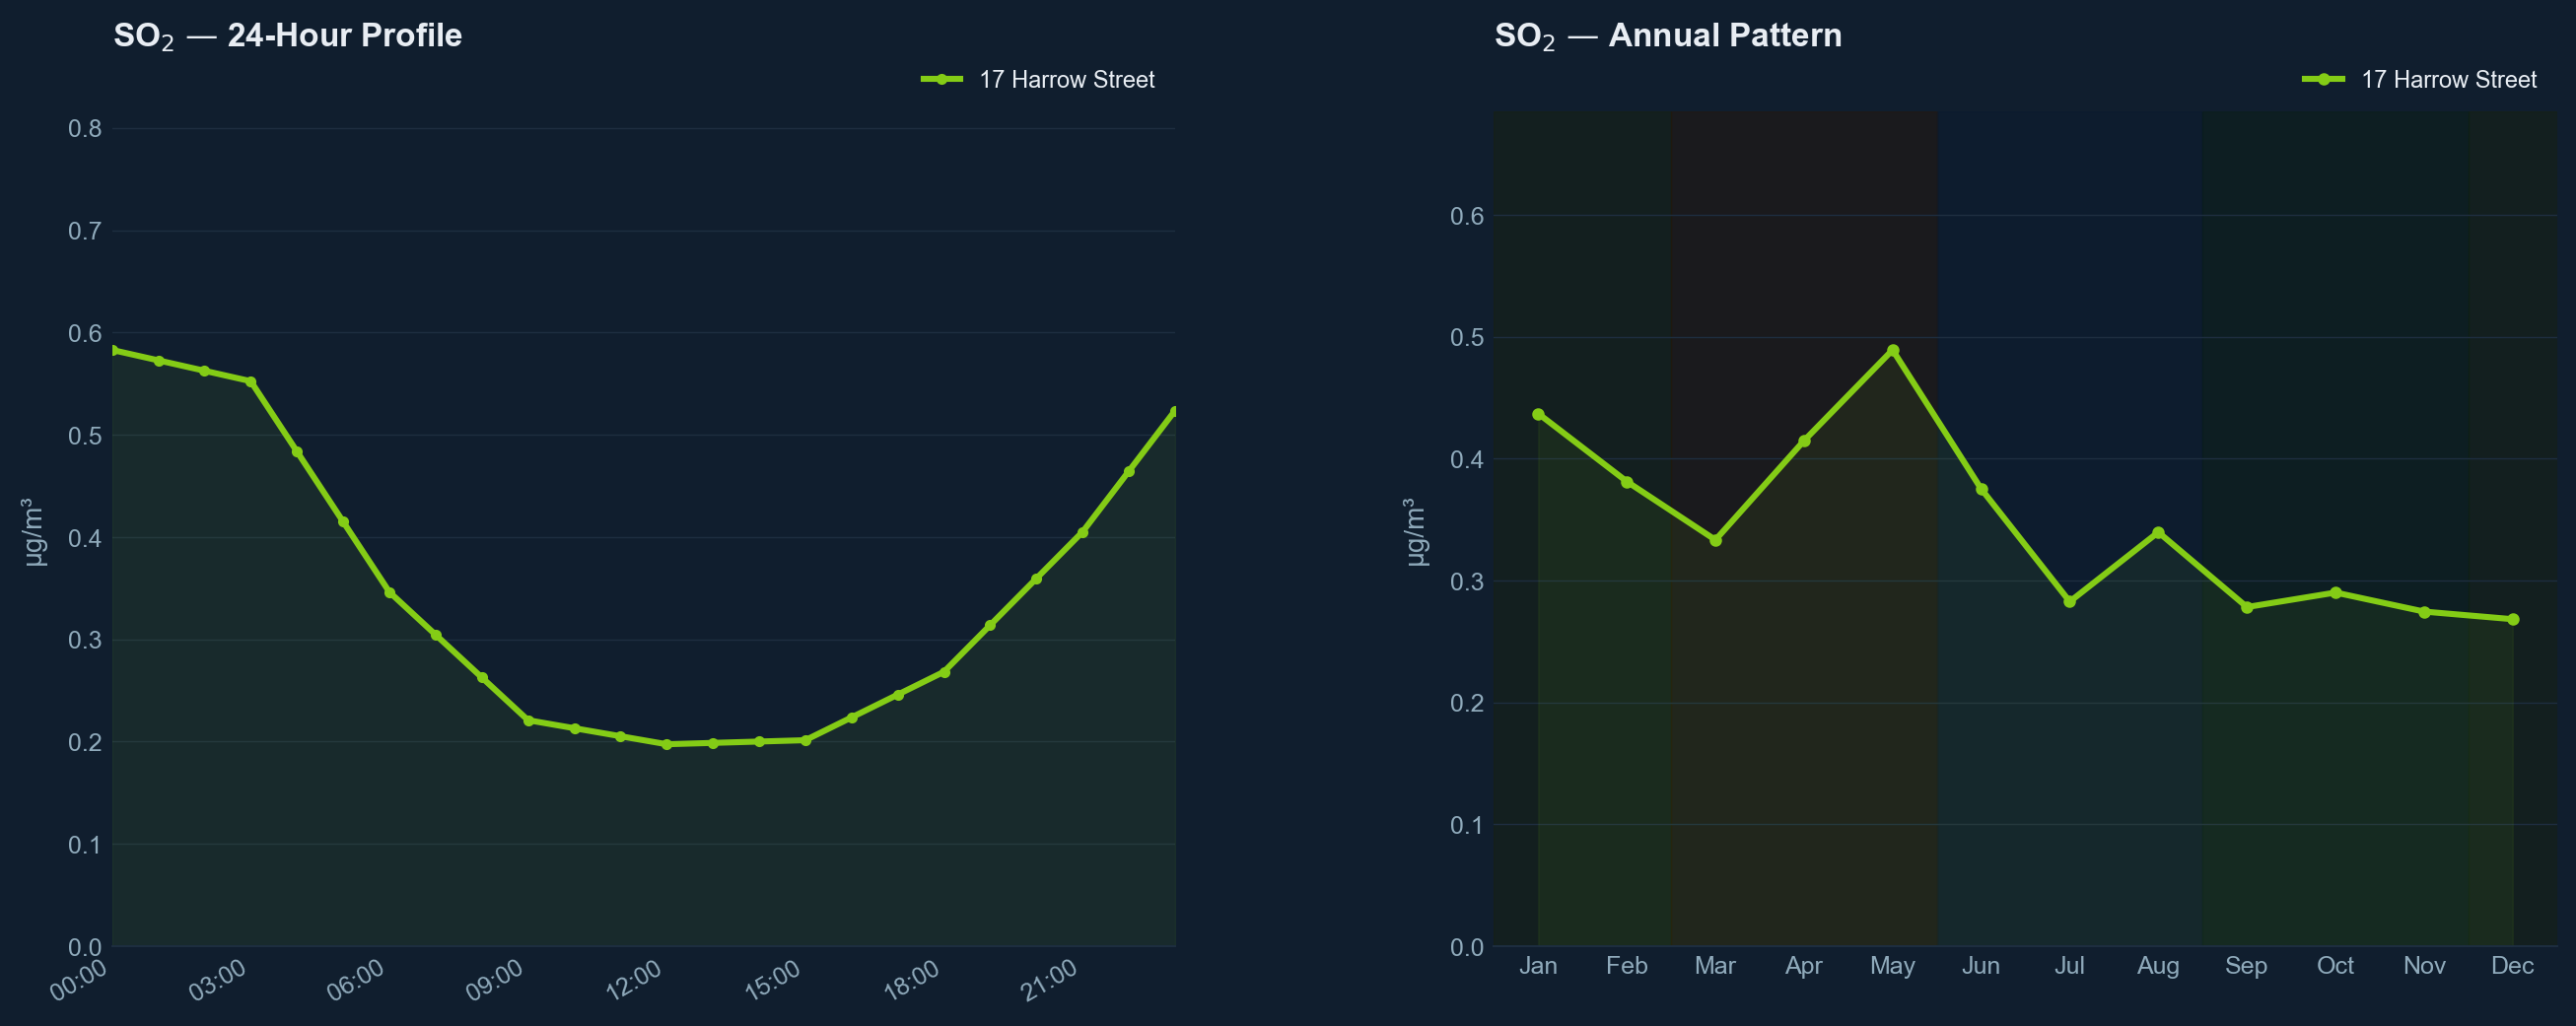
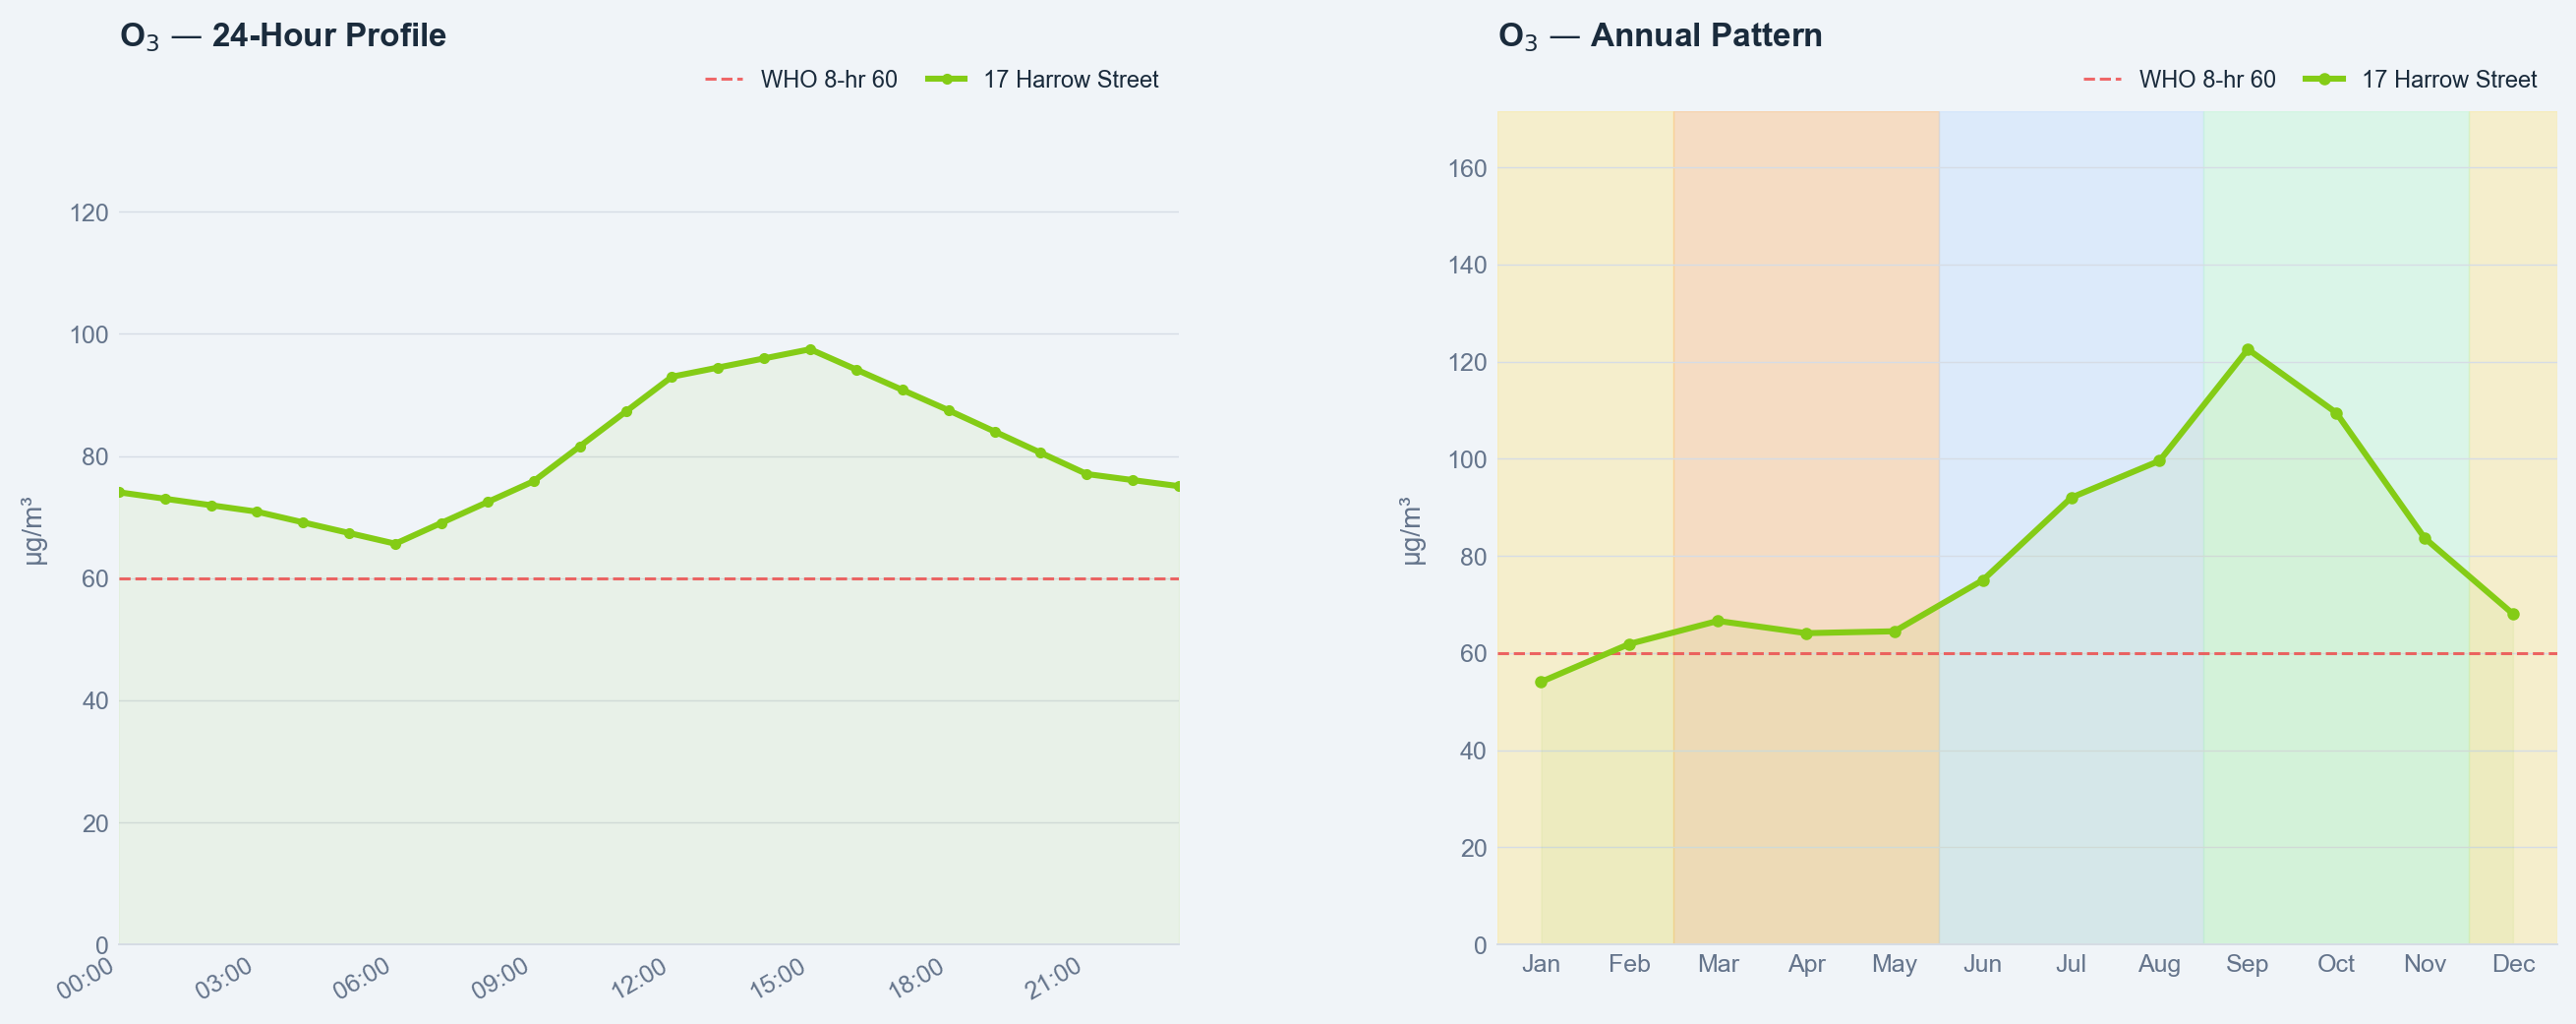
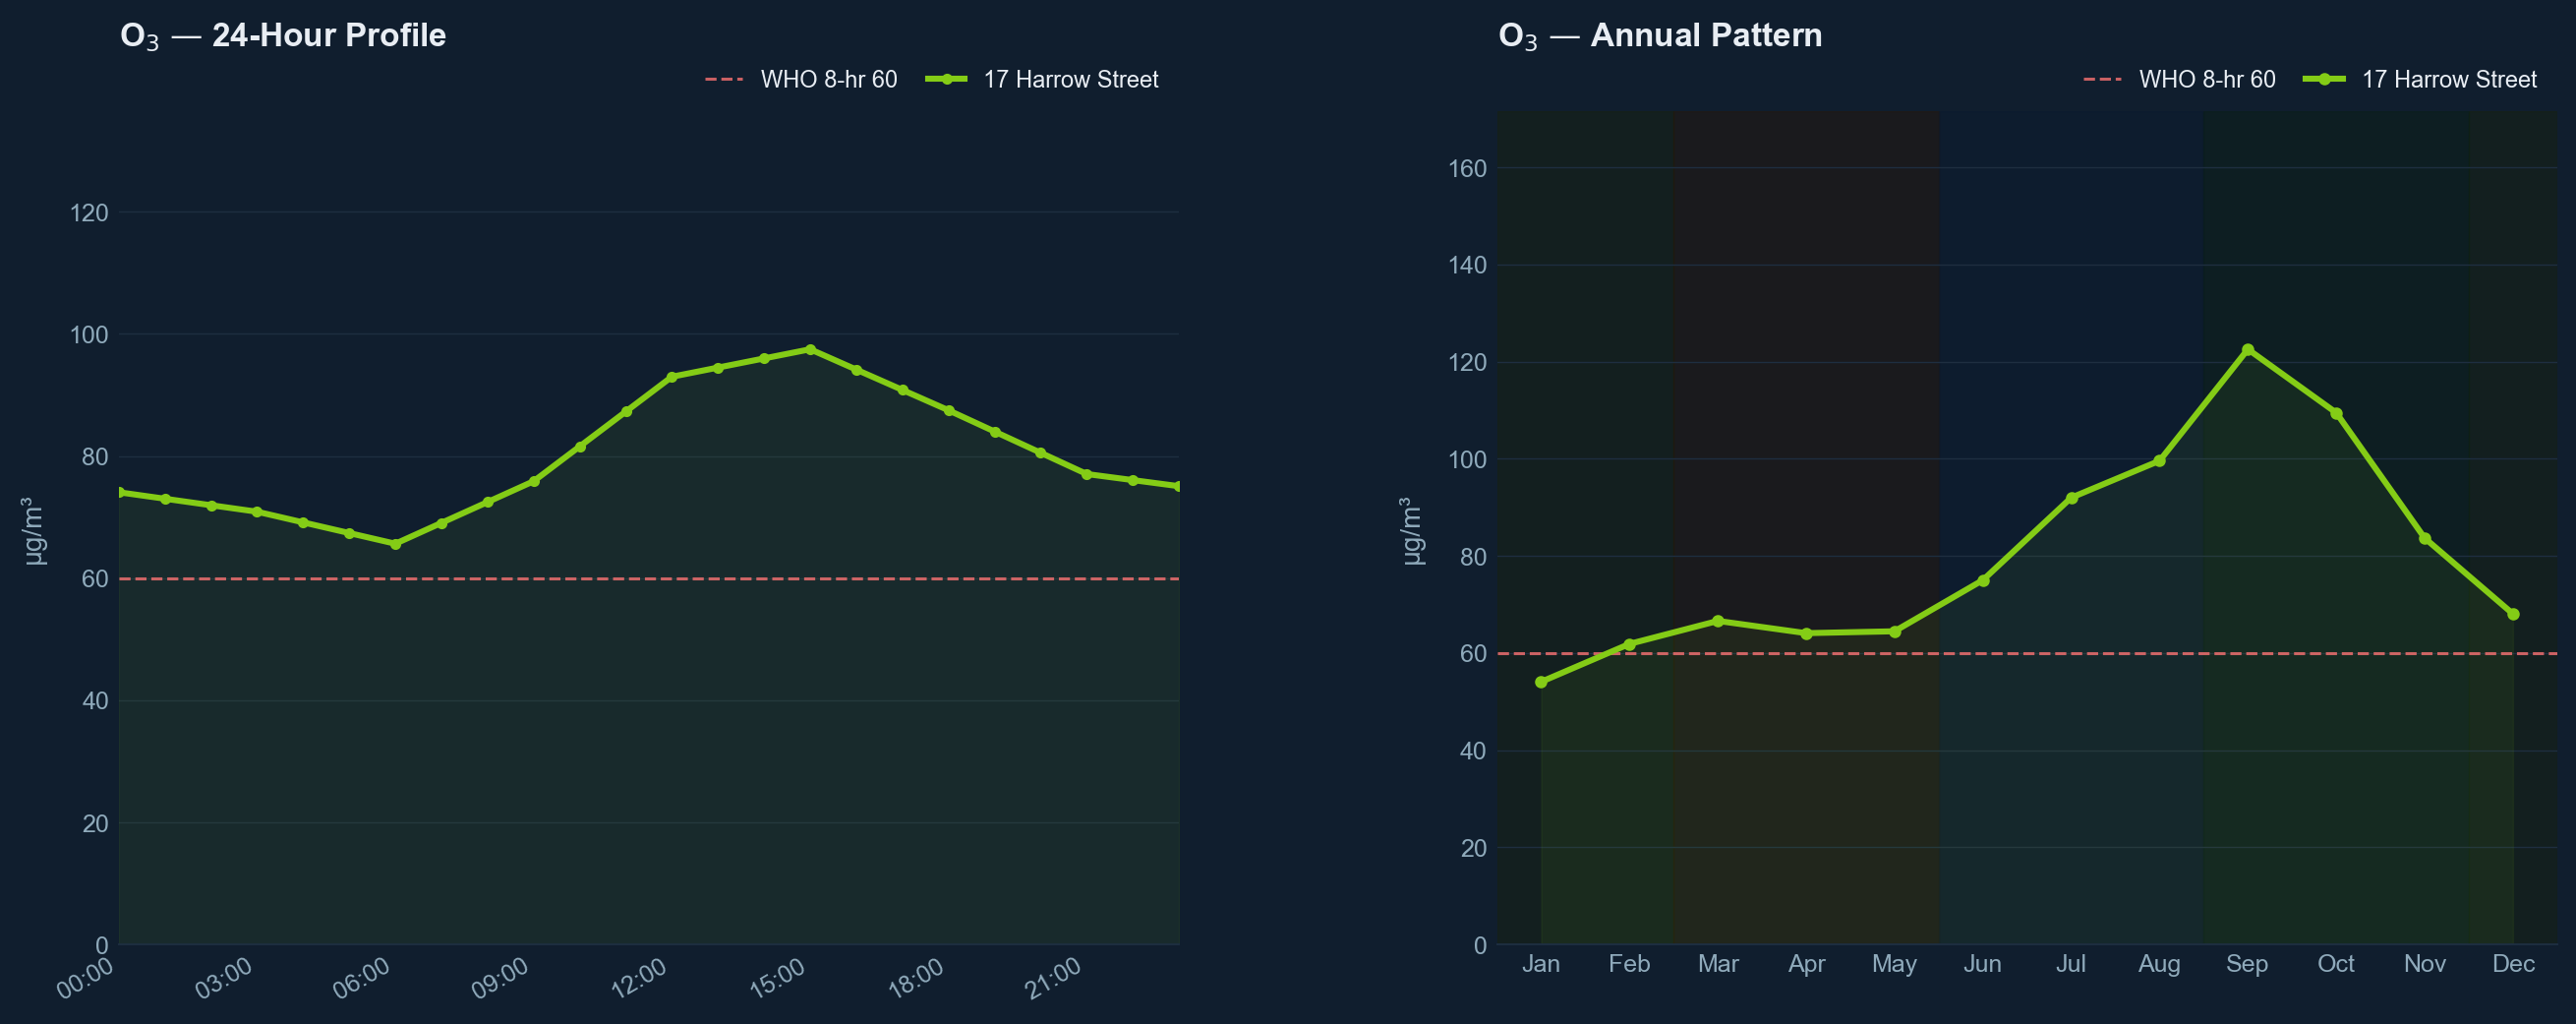
Each pollutant shows the 24-hour profile (left) and annual pattern (right). WHO guidelines are shown as dashed red lines only when they fall within twice the range of the data.
Wastewater & Industrial Odours
Known odour sources within 5 km of this property that may cause periodic smell depending on wind conditions. Includes hydrogen sulphide (H₂S) plume modelling where available.
| Source | Distance | Proximity risk | Odour type |
|---|---|---|---|
| Christchurch Wastewater Treatment Plant (Bromley oxidation ponds) | 2.8 km | Nearby (2–3 km) | H2S (hydrogen sulphide), mercaptans CCC monitoring ↗ |
| Wind: Christchurch prevailing winds are northwesterly (nor'wester). Under NW winds the plume travels southeast toward Bexley, Bromley, and Wainoni. Easterly sea breezes (common in summer afternoons) push odour northwest toward Phillipstown, Woolston, and St Martins. | |||
Coordinates are approximate (±200 m). Odour frequency and intensity depend heavily on wind direction and weather stability. Source: SpotCheck odour database, based on resource consent data and council environmental reports. This section covers known major sources only — always request a LIM report for a complete picture.
Pollen season estimates based on regional monitoring data. Counts vary by location, weather, and year — these are typical values, not a live forecast. Rain reduces dispersal; warm, dry, windy days drive peaks.
Noise
Noise
Traffic noise at the property measures 66.3 dB Lden, which exceeds both the WHO guideline of 53 dB and the New Zealand standard NZS 6802 of approximately 55 dB. This elevation above regulatory thresholds indicates that open-window sleeping may be disrupted and outdoor conversations conducted at normal volumes could be affected by background traffic sound. The combined noise environment, inclusive of all sources, yields 67.0 dB and a moderate noise score of 6.6/10.
Aircraft noise at 43.8 dB day-night average remains within WHO recommendations (45 dB) and well below New Zealand national limits, contributing minimally to the overall noise burden. The property's traffic and combined noise levels notably exceed those of the city average (51.6 dB traffic, 67.0 dB combined versus city average), though the WHO guidelines applied here are considerably more stringent than New Zealand's national standards.
| Level | Everyday example | How it feels / benchmark | |
|---|---|---|---|
| 30 dB | Quiet bedroom at night, library | Very peaceful — barely perceptible background | |
| 40 dB | Quiet whisper, fridge hum | WHO night-time guideline (outside bedroom) | |
| 50 dB | Light rain, quiet suburban street | Comfortable — easy to relax and sleep | |
| 55 dB | Normal conversation at 1 m, light traffic | WHO daytime road-traffic guideline | |
| 60 dB | Busy office, group conversation | Steady background buzz, still tolerable | |
| 65 dB | Busy urban road, vacuum cleaner across room | Disrupts conversation; harder to relax | |
| 70 dB | Heavy traffic at 5 m, dishwasher | NZS 6802 daytime residential limit | |
| 80 dB | Garbage disposal, alarm clock at 1 m | Stressful for long periods; raises voice to talk | |
| 85+ dB | Lawnmower, motorcycle pass-by | Hearing damage with prolonged exposure |
Aircraft Noise Exposure
45 dB
65 dB
Aircraft noise includes proximity to the airport and ILS approach corridor modelling (noise from planes on final approach, not just near-airport zones). Day-night average (Ldn/Lden). WHO guideline 45 dB · NZS 6805 standard 65 dB.
Level Crossings & Train Horns
| Crossing | Distance | Indicative horn level | At the property | Protection |
|---|---|---|---|---|
| Level crossing | 1,340 m | 74 dB peak | clearly audible — likely to wake light sleepers | Barriers |
| Level crossing | 1,345 m | 74 dB peak | clearly audible — likely to wake light sleepers | Barriers |
| Level crossing | 1,349 m | 74 dB peak | clearly audible — likely to wake light sleepers | Barriers |
| Level crossing | 1,462 m | 73 dB peak | clearly audible — likely to wake light sleepers | Barriers |
| Level crossing | 1,466 m | 73 dB peak | clearly audible — likely to wake light sleepers | Barriers |
Vehicular level crossings within 2,500 m from OpenStreetMap. Indicative peak horn level estimated at the property from a 110 dB(A) source at 30 m using point-source spreading plus low-frequency air absorption (L(d) = 110 − 20·log₁₀(d/30 m) − 2·(d/1000)). Actual exposure depends on how often horns sound, terrain, screening and wind — treat as a guide, not a measurement.
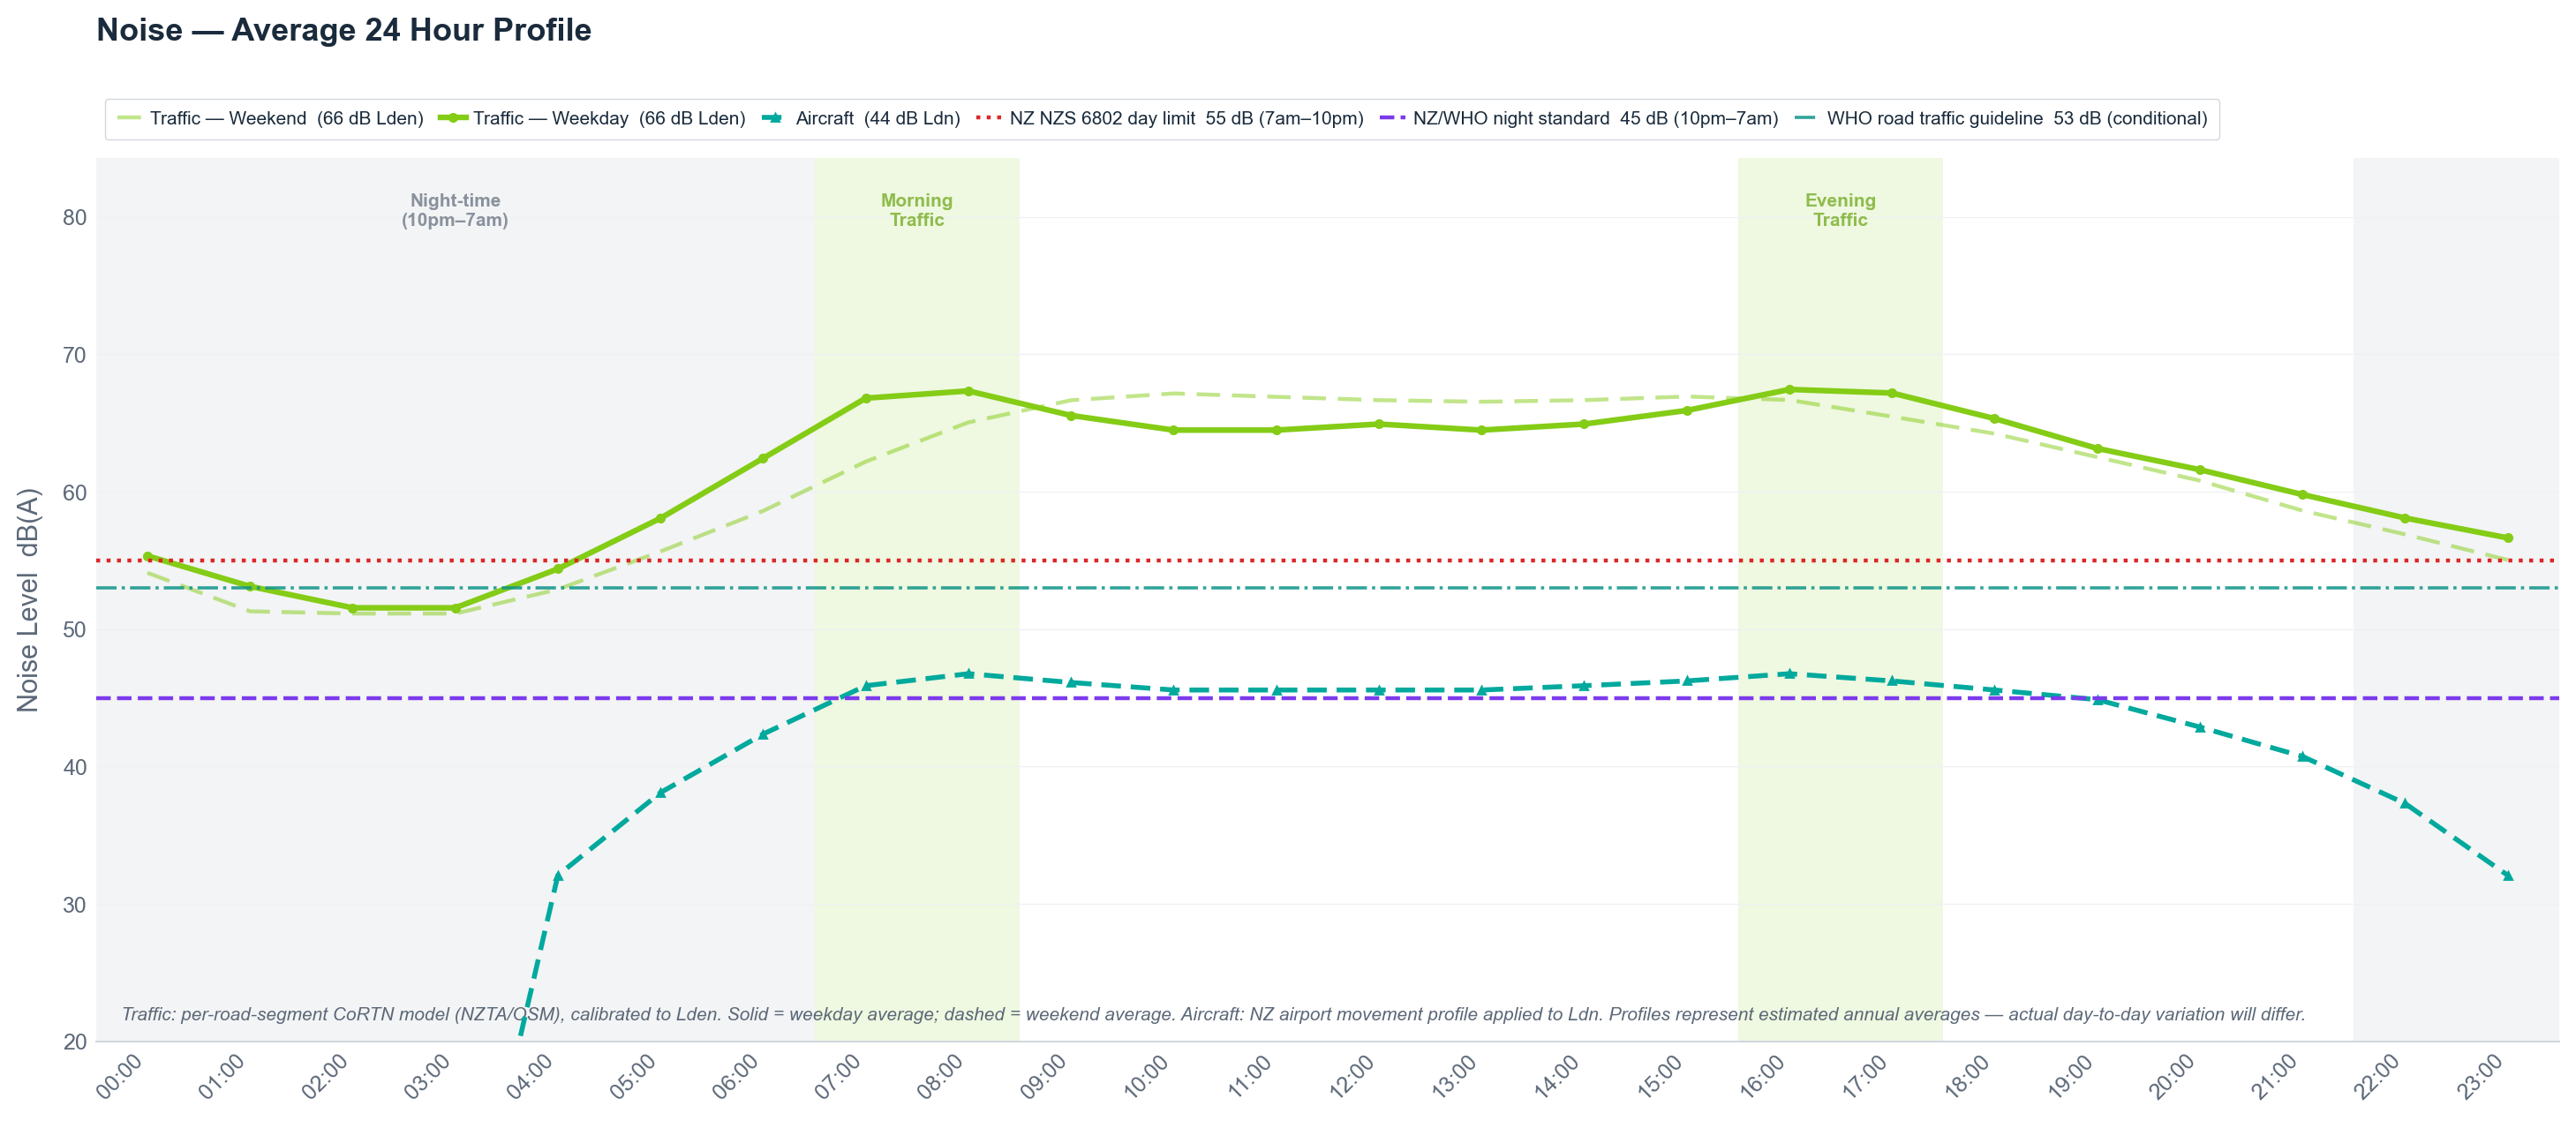
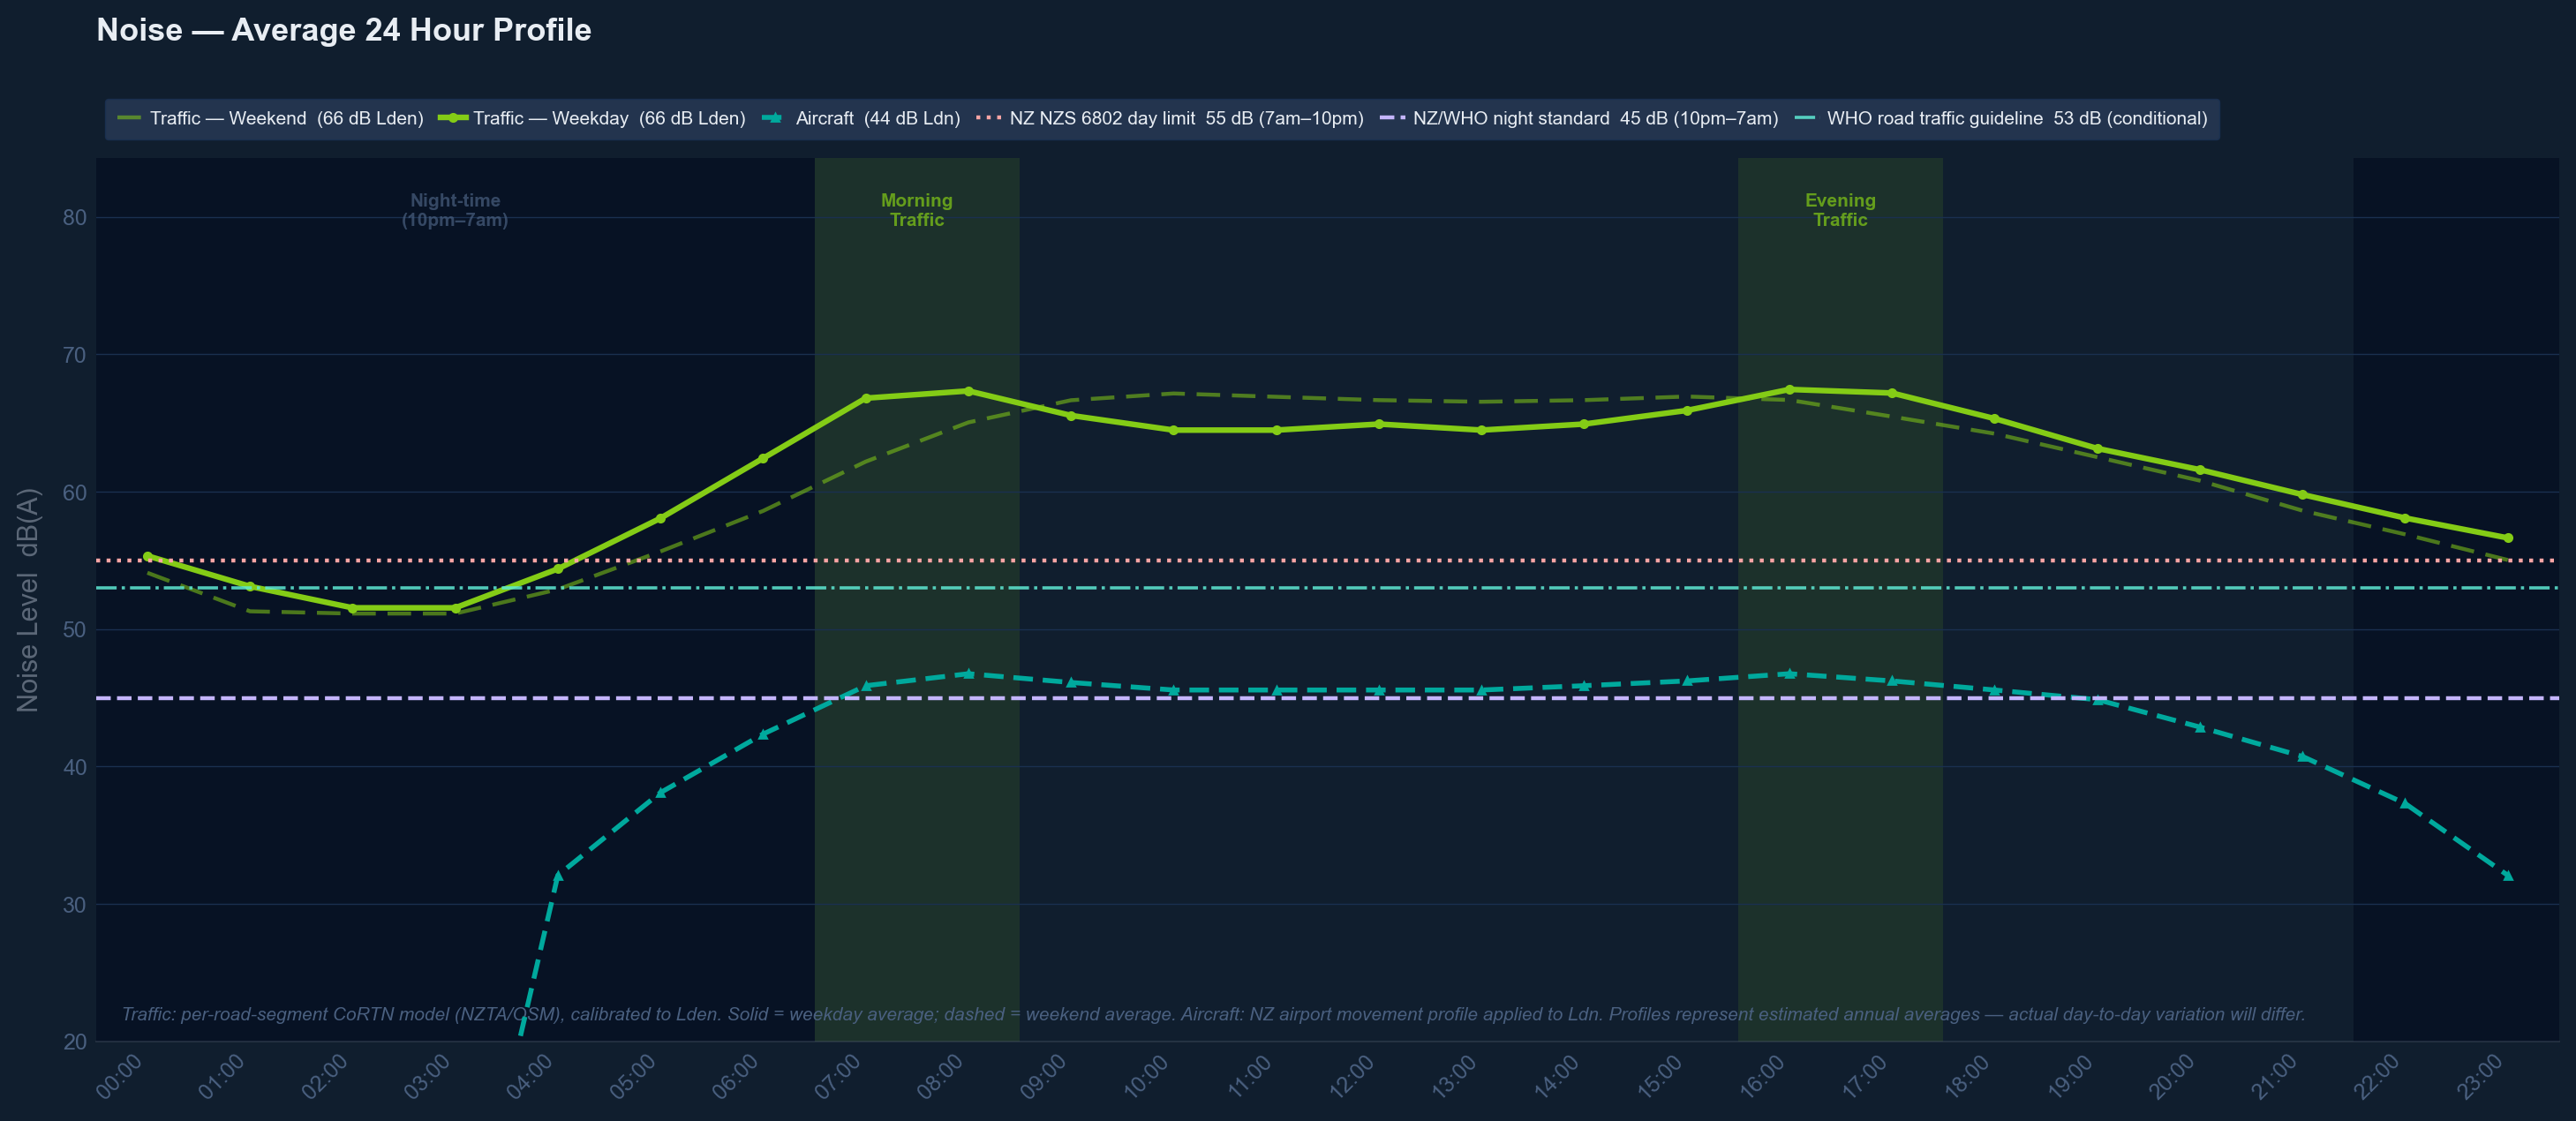
Estimated noise levels over an average 24-hour day. Traffic modelled from hourly flow profile; aircraft distributed by NZCH movement schedule. Freight trains shown during typical operating window (9pm–6am) — actual pass times vary.
Traffic noise: CoRTN model applied to NZTA/OpenStreetMap road network (Lden — day-evening-night average, with evening and night annoyance weightings), including heavy vehicle correction by road type.Aircraft noise: published contour data extended with ILS approach corridors (3° glideslope model) — includes noise from planes on final approach, not just proximity to airport. Railway noise: line-source model from OpenStreetMap railway data (Leq equivalent). City average is the mean across all urban grid cells. WHO 2018 Environmental Noise Guidelines. NZ standards: NZS 6802:2008, NZS 6805:1992.
Model limitations: Traffic noise estimates are based on NZTA average daily traffic counts and road classifications. The model may underestimate noise on roads with unusually high heavy-vehicle or bus traffic, steep gradients where vehicles accelerate significantly, or roads with high actual speeds relative to the posted limit. On-site assessment is recommended for properties immediately adjacent to arterial roads or known truck routes.
Crime Safety
Crime Safety
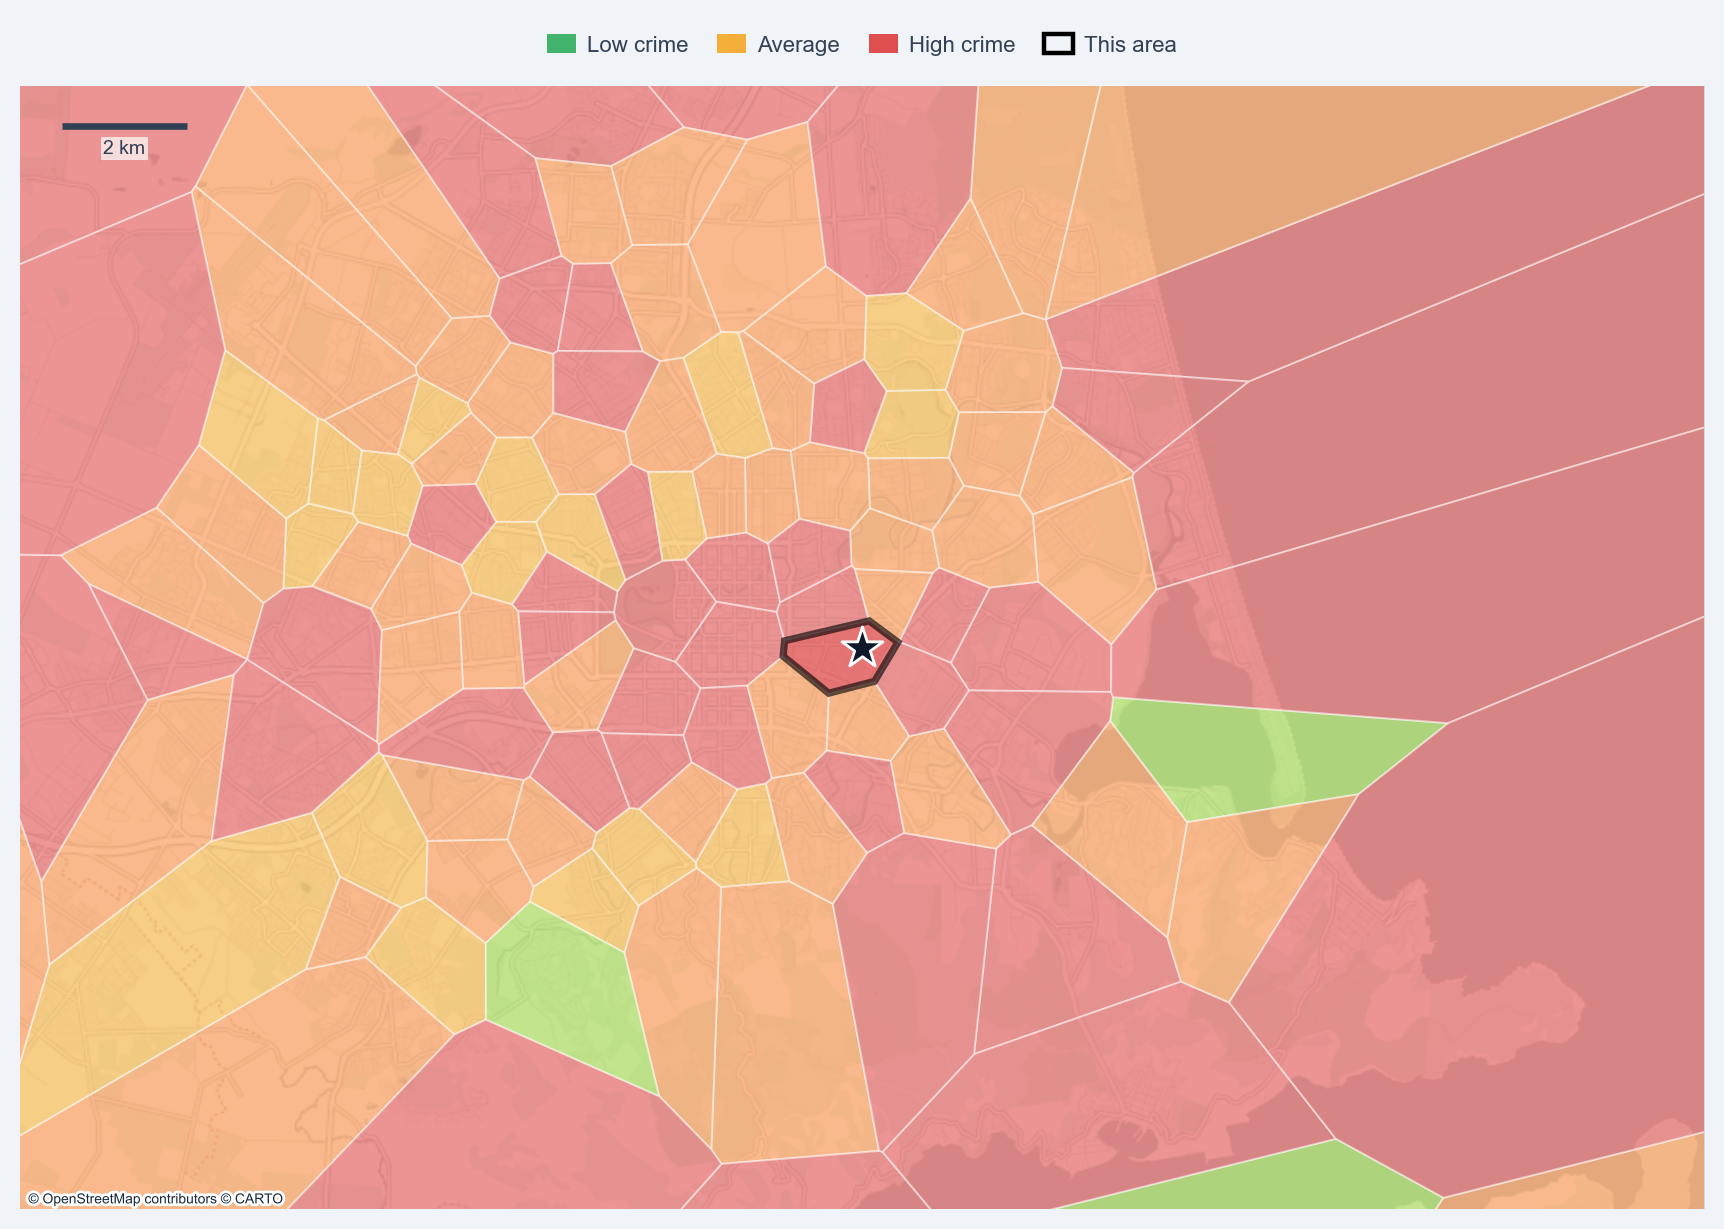
Phillipstown's crime profile shows a generally positive trend across most categories, with an overall safety score of 9.5/10. Burglary (76.6 per 10,000 residents), vehicle theft (69.5 per 10,000), and violent crime (30.2 per 10,000) are the most prevalent offences; all three have declined year-on-year, with burglary down 11%, other theft down 24%, and violent crime down 2%. Sexual offences remain very low in absolute terms (3 incidents) and year-on-year comparisons are not meaningful at this scale. These figures are area-level statistics for the Phillipstown suburb and do not reflect property-specific risk.
Violent and sexual crime combined account for 15.6% of total offences in the area, which is above the New Zealand national average of 13.2%. However, the downward trajectory in violent crime and the sharp reduction in other theft categories suggest the local crime environment is improving. The suburb's relatively young, family-oriented demographic (63% of households contain children) and moderate population density appear consistent with a suburb in transition towards lower crime rates.
| Category | 2023 | 2024 | 2025 | Rate / 10k (2025) | Christchurch average / 10k | Trend (2024 → 2025) |
|---|---|---|---|---|---|---|
| Violent Crime | 77 | 61 | 60 | 30.2 | 76.7 | ↔ stable |
| Sexual Crime | 7 | 6 | 3 | 1.5 | 8.9 | ↓ 50% |
| Burglary Crime | 201 | 170 | 152 | 76.6 | 156.6 | ↓ 11% |
| Vehicle Theft Crime | 217 | 133 | 138 | 69.5 | 220.9 | ↔ stable |
| Other Theft Crime | 82 | 67 | 51 | 25.7 | 375.0 | ↓ 24% |
| Violent + Sexual | 84 | 67 | 63 | 31.7 | 85.6 | ↓ 6% |
Annual incident counts for the Phillipstown NZ Police Area Unit. Rate per 10,000 residents uses 2025 counts and 2023 Census population for the local NZ Police Area Unit. Christchurch average uses 2025 totals across all area units in Christchurch City — green = this area is below average, red = above average. Trend shows % change from 2024 to 2025 ↓ green = improving, ↑ red = worsening. Source: NZ Police Victimisation Time and Place 2023–2025. Area-level statistics only — not individual property risk.
Neighbourhood and Property Disputes
729 property-related Disputes Tribunal claims were filed in the Christchurch District Court catchment between 2021 and 2025. Adjusted for the catchment's population, that is 13.6 per 10,000 residents — above the national rate of 13.2, and the 16th-highest of 56 court catchments. These are civil disputes between neighbours and over property — a measure of local friction that crime statistics do not capture.
Fencing and neighbour disputes: 175 Property damage or injury: 360 Property loss or recovery: 194
2021: 142 2022: 116 2023: 152 2024: 166 2025: 153
Source: New Zealand Ministry of Justice, Disputes Tribunal property-related claims by court location. Counts cover the District Court nearest to this property and reflect a wide catchment, not the immediate street.
Workplace Safety in the Wider Region
WorkSafe New Zealand recorded 3,432 notifiable workplace events (deaths, serious injuries, and dangerous incidents) across the Canterbury region between 2021 and 2025. The leading cause was machinery and (mainly) fixed plant. Adjusted for population, that is 492 events per 100,000 residents — above the national rate of 432, and the 9th-highest of 16 regions. Smaller regions record fewer events in total, so the per-person rate is the fairer comparison.
2021: 622 2022: 704 2023: 796 2024: 629 2025: 681
Source: WorkSafe New Zealand notifiable events by region of event. Reported at regional level only, so this reflects the wider region rather than this specific address.
 Climate & Weather
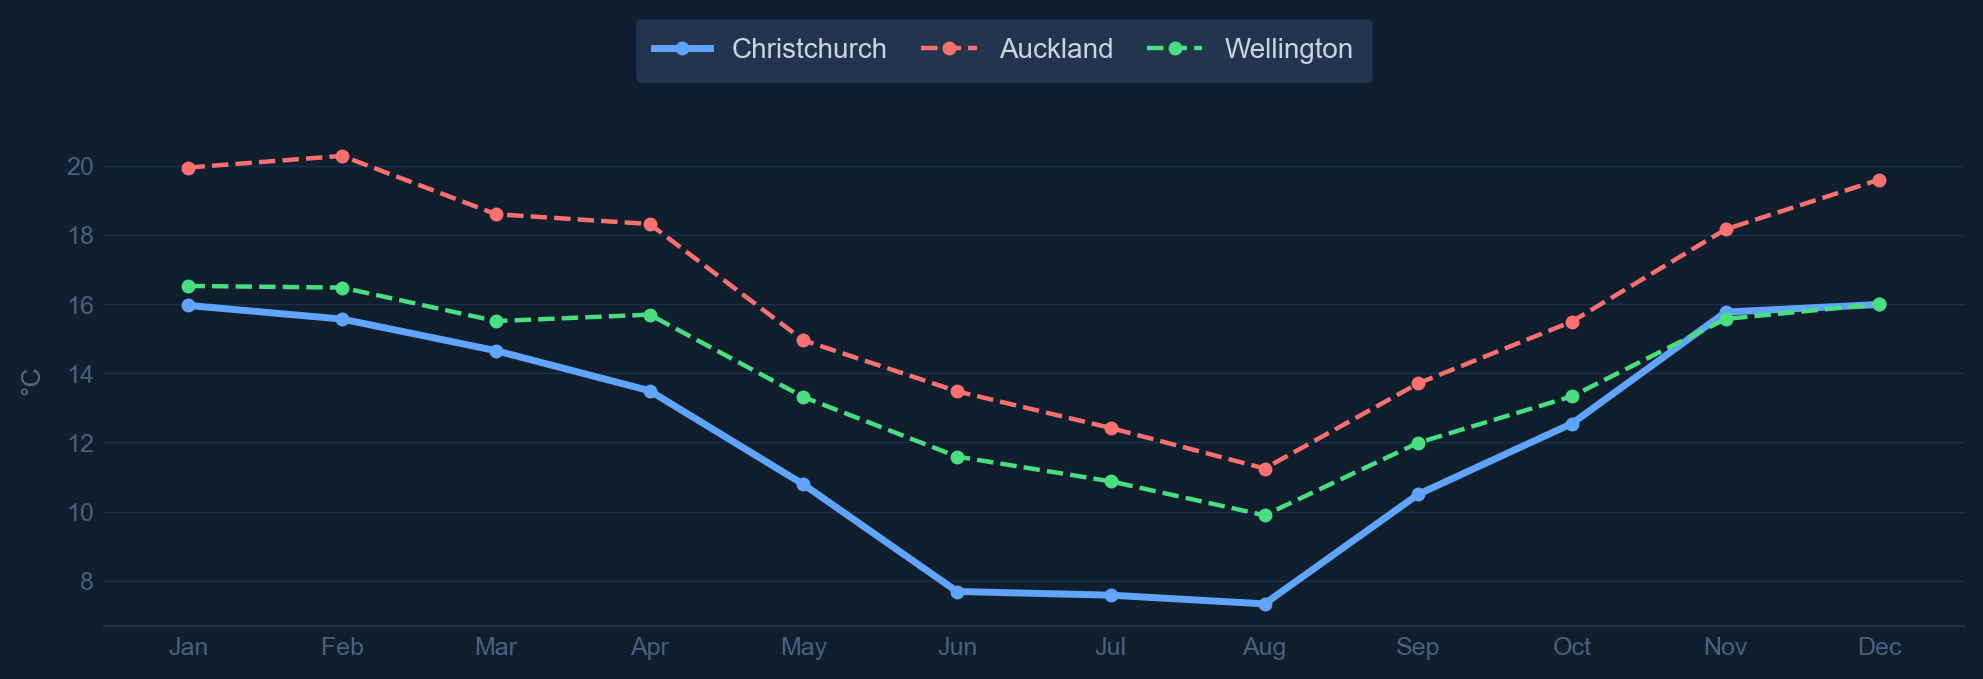
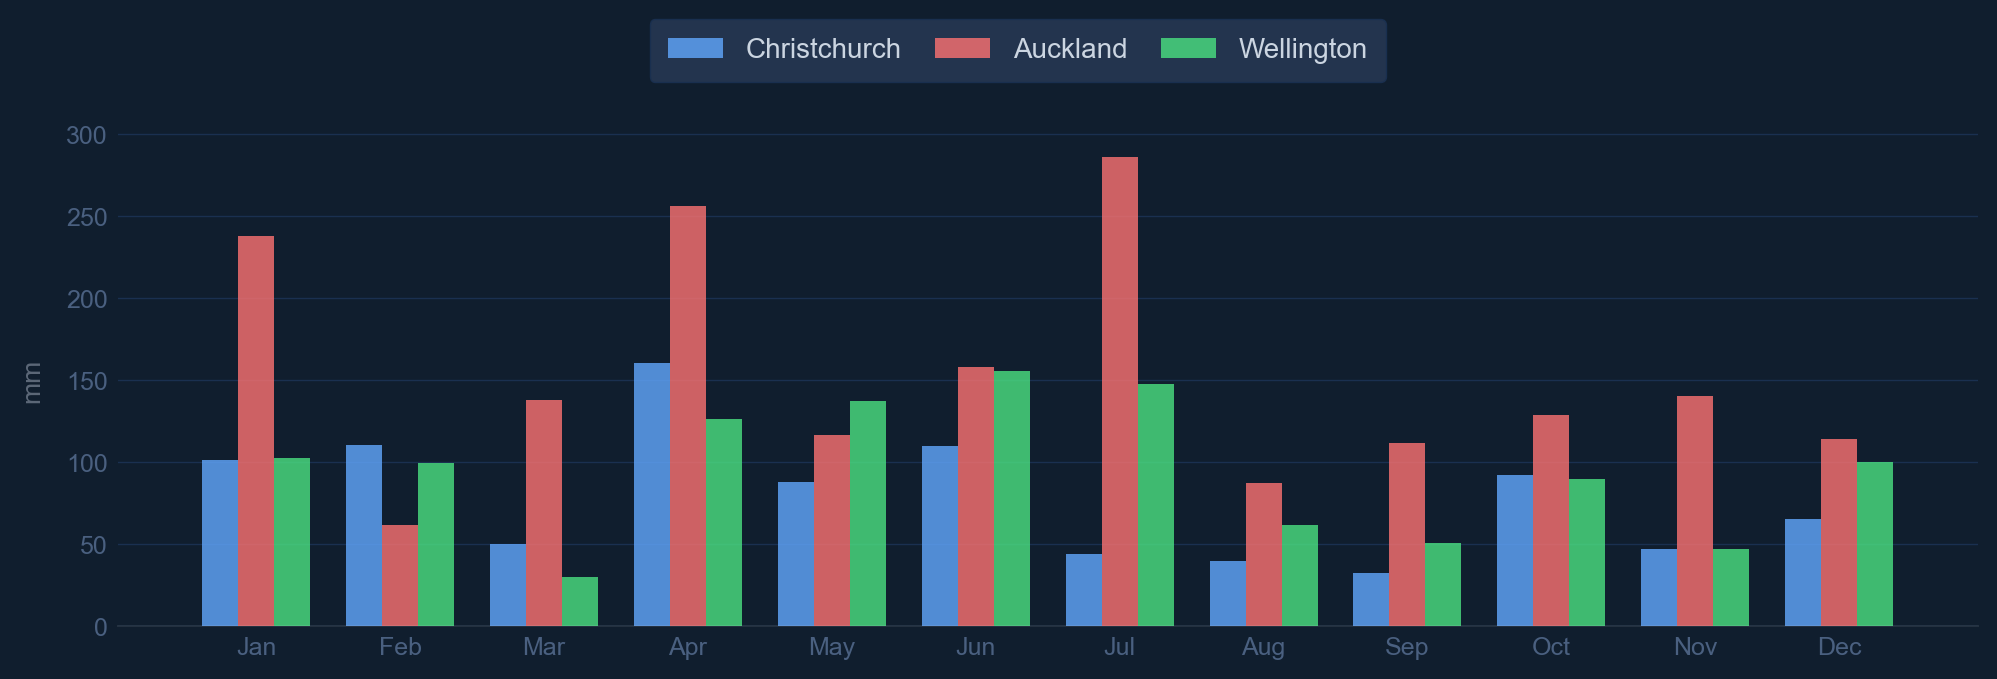
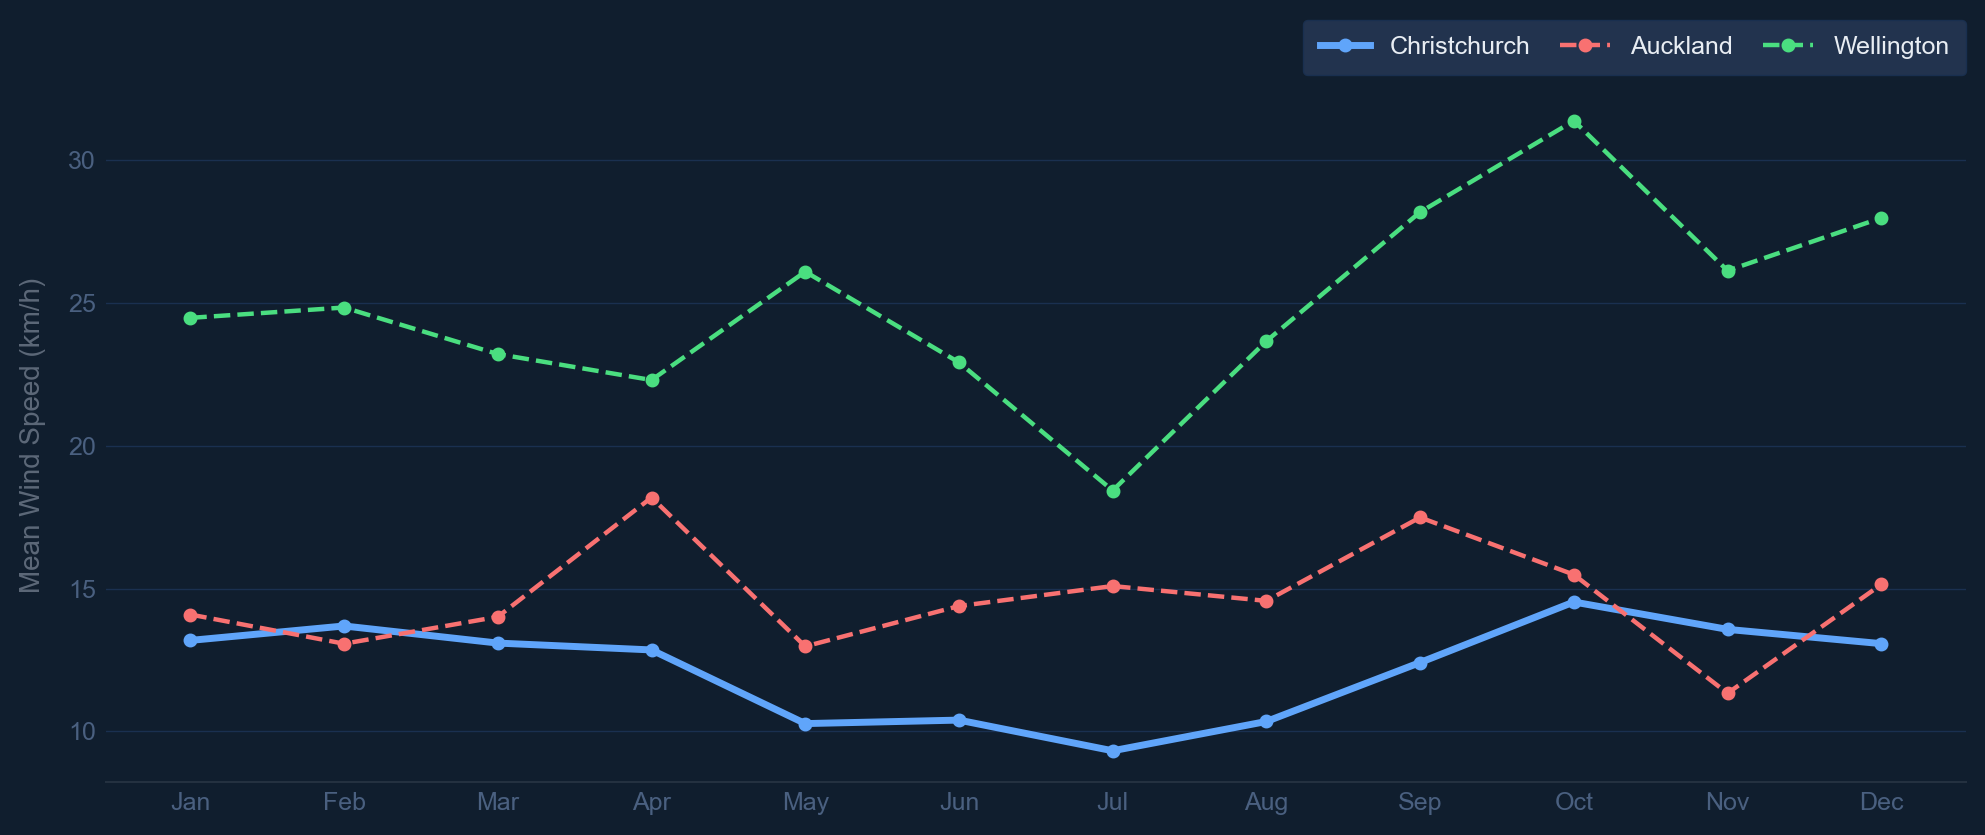
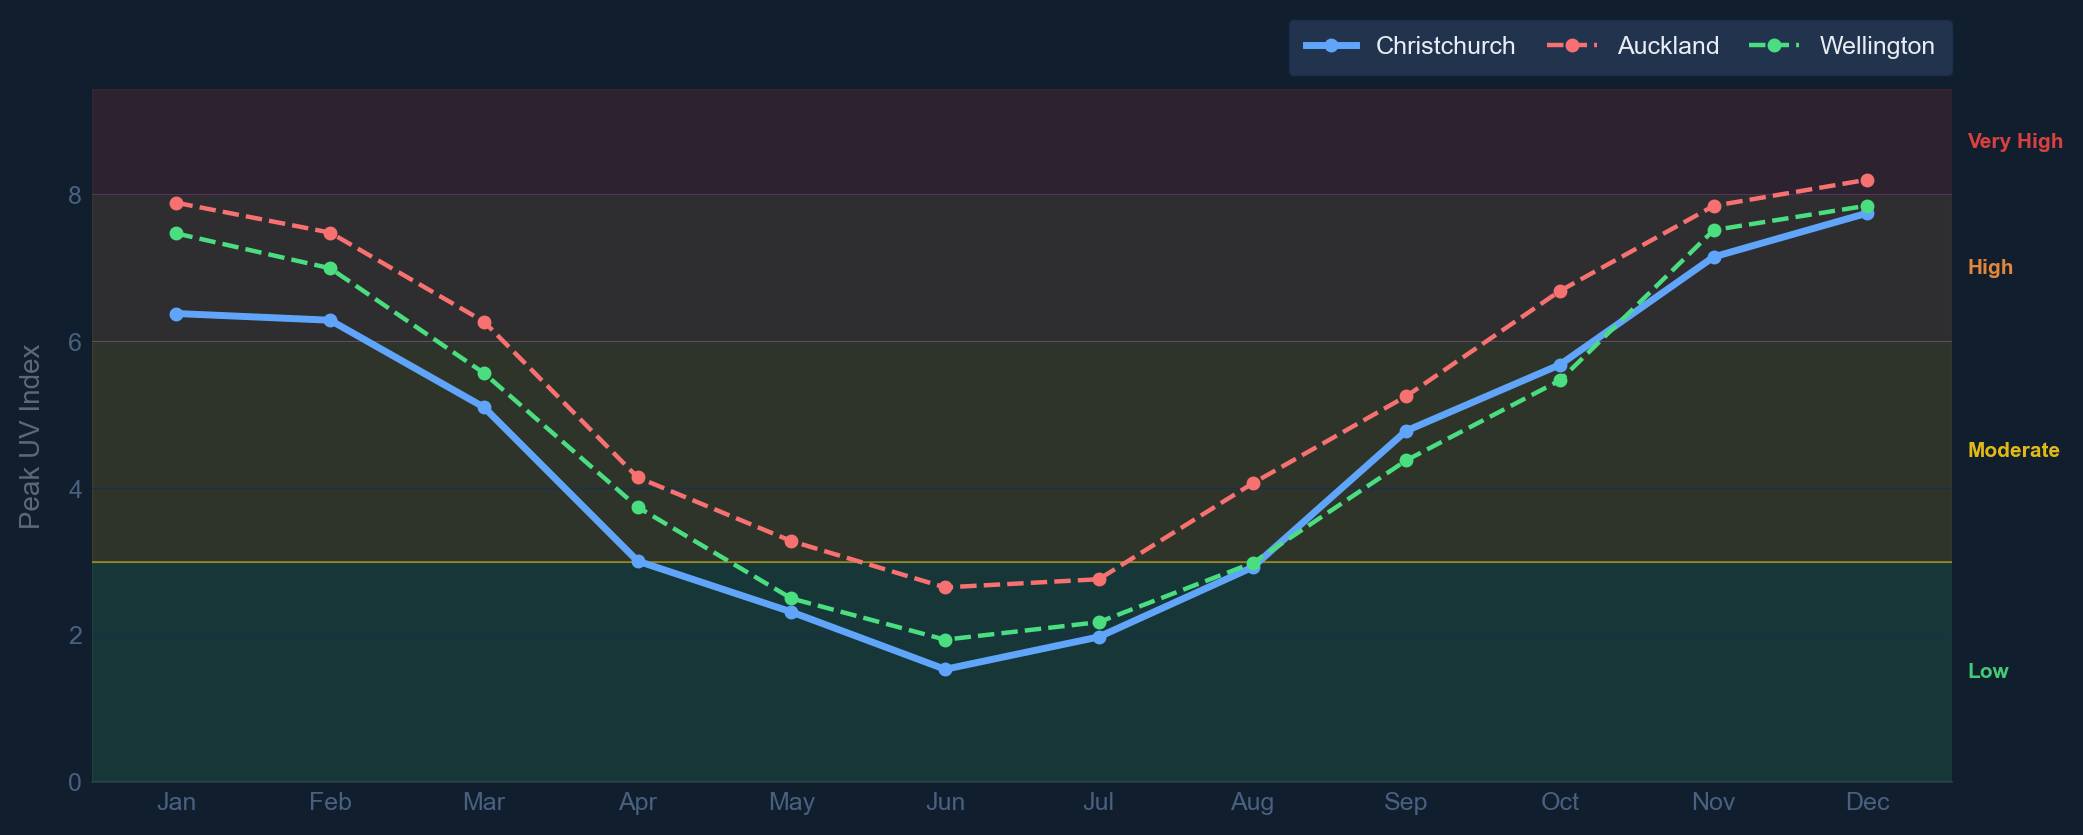
Christchurch offers a cooler climate with a mean annual temperature of 12.3°C compared to Auckland's 16.3°C and Wellington's 13.9°C, presenting a notably larger seasonal range (7–16°C versus Auckland's 11–20°C), which may appeal to those preferring milder summers but requiring adequate heating during winters. Rainfall is considerably lower at 942 mm annually, roughly half that of Auckland (1837 mm) and somewhat below Wellington (1150 mm), making it the driest of the three cities and potentially advantageous for property maintenance and outdoor activities. Sunshine hours are comparable across all three locations (Christchurch 2128 hours annually versus Auckland's 2122 and Wellington's 2094), though Christchurch experiences a slightly lower summer UV index peak of 6.8 compared to Auckland's 7.9, reducing skin cancer risk exposure. Wellington stands apart with significantly higher mean wind speeds of 25.0 km/h compared to Christchurch's 12.2 km/h, a material consideration for residents sensitive to wind exposure and building maintenance requirements.
Temperature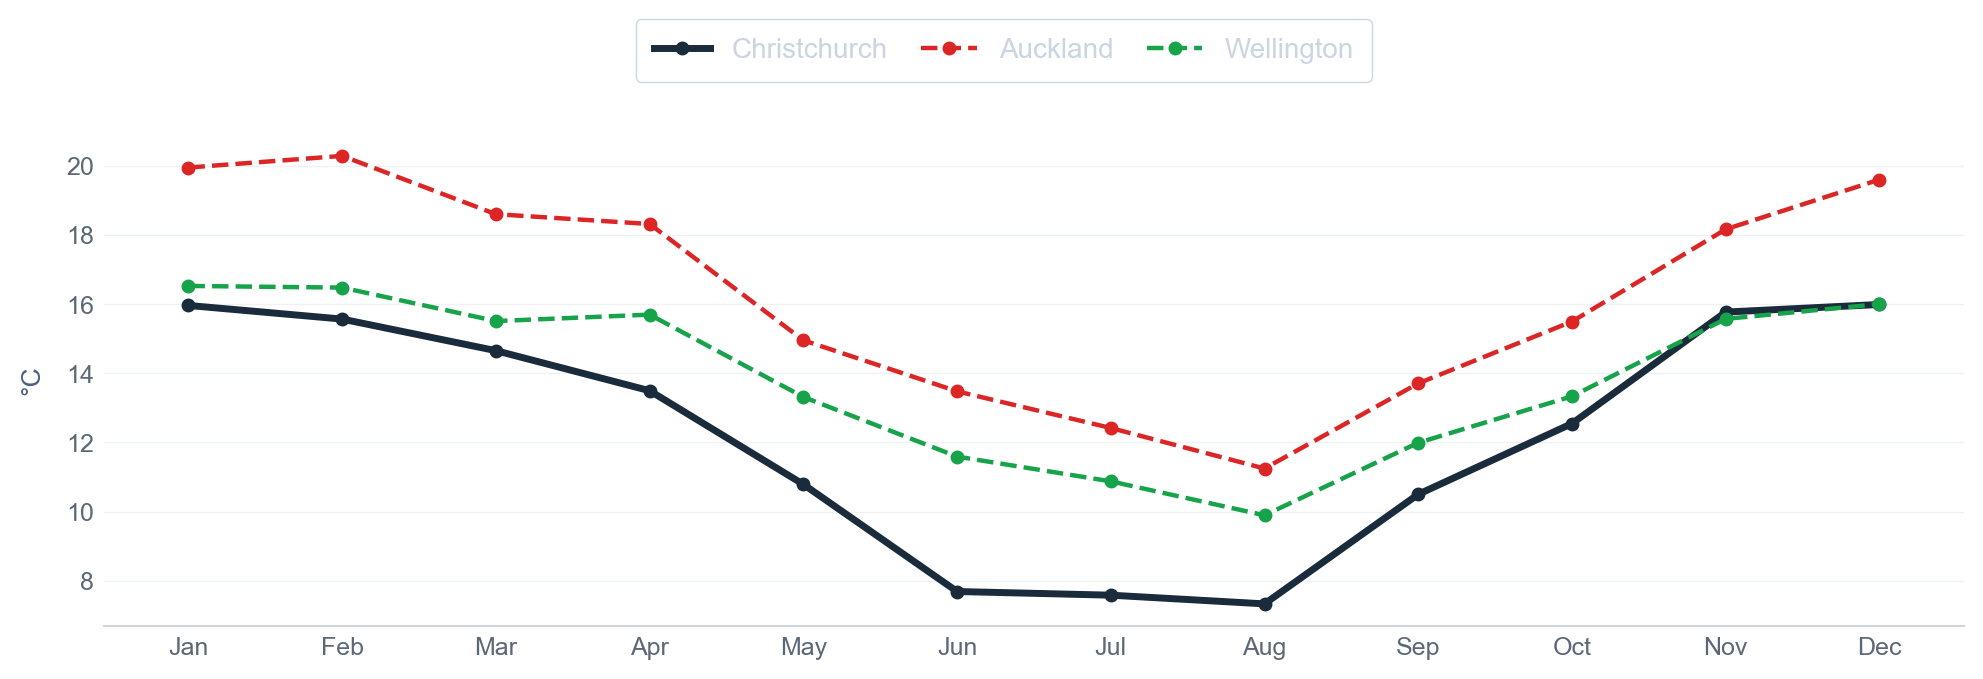
 Monthly Rainfall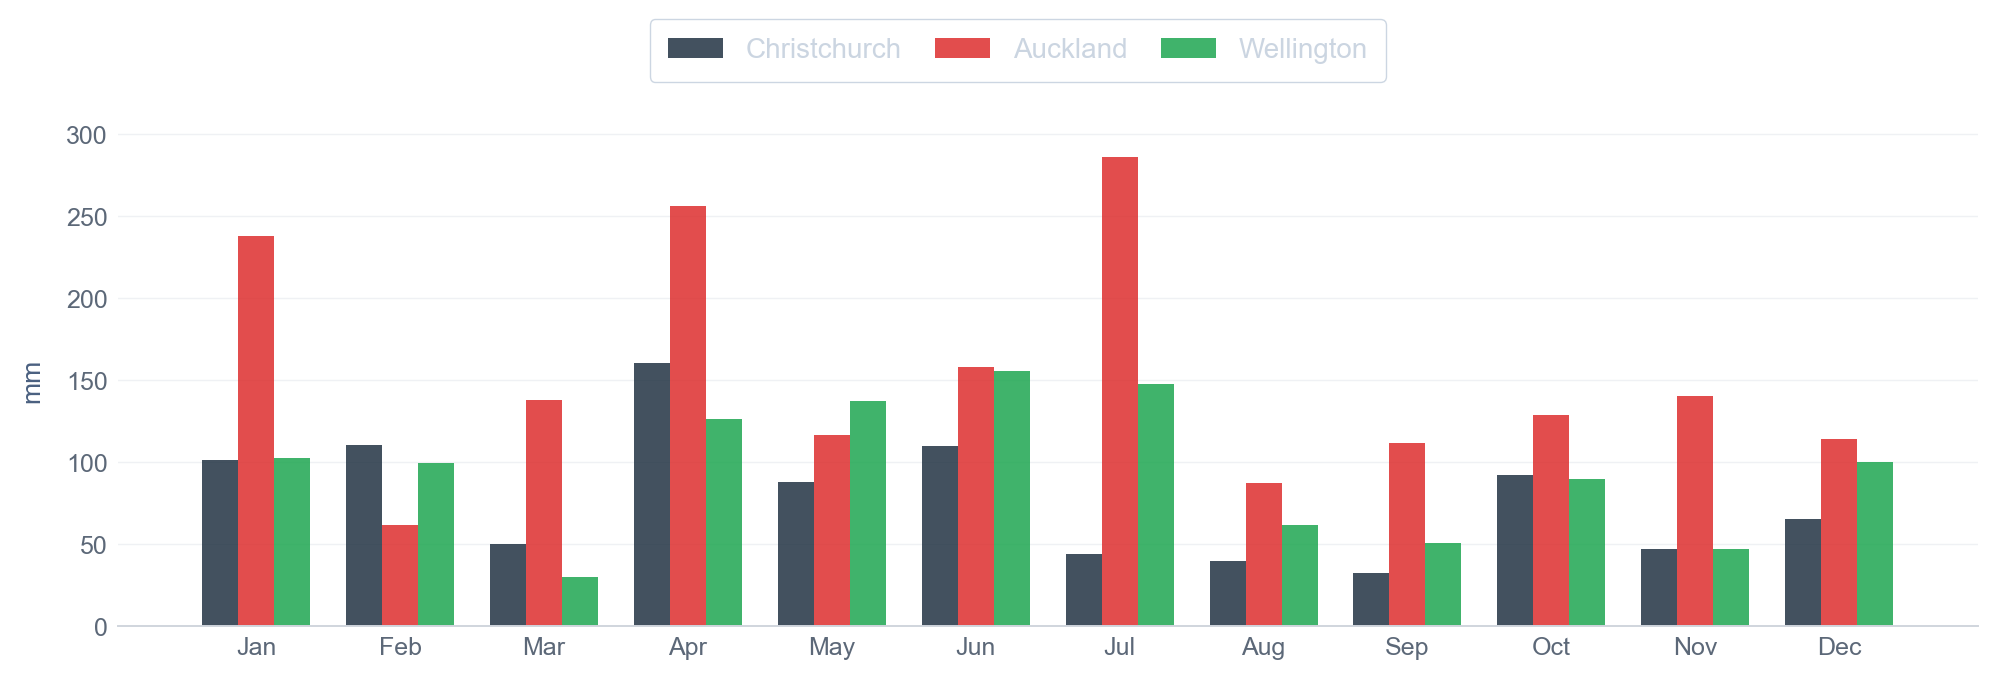
 Relative Humidity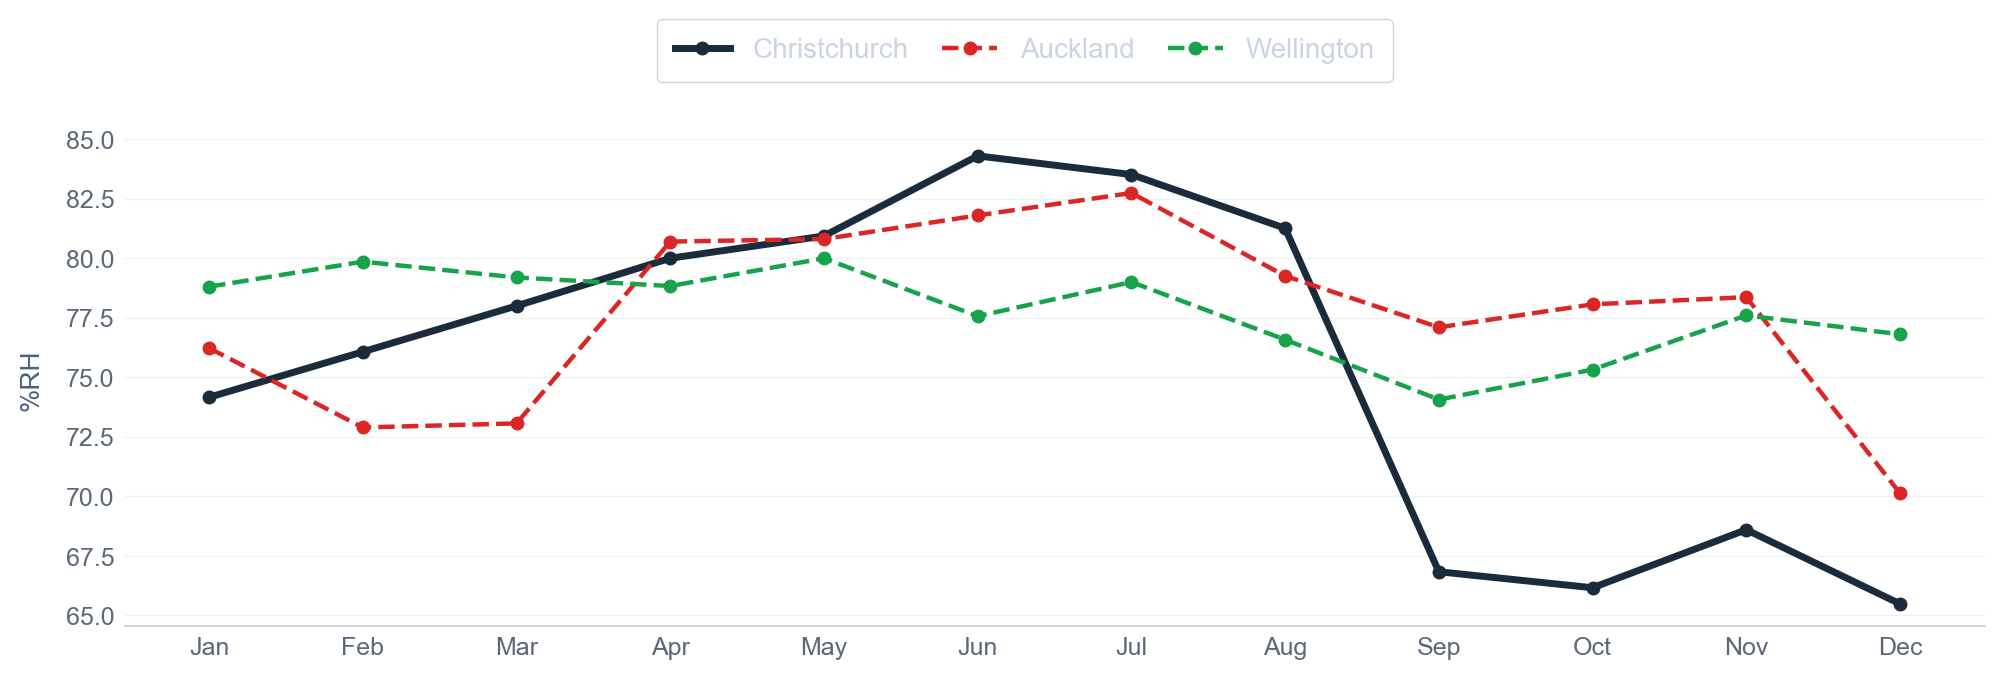
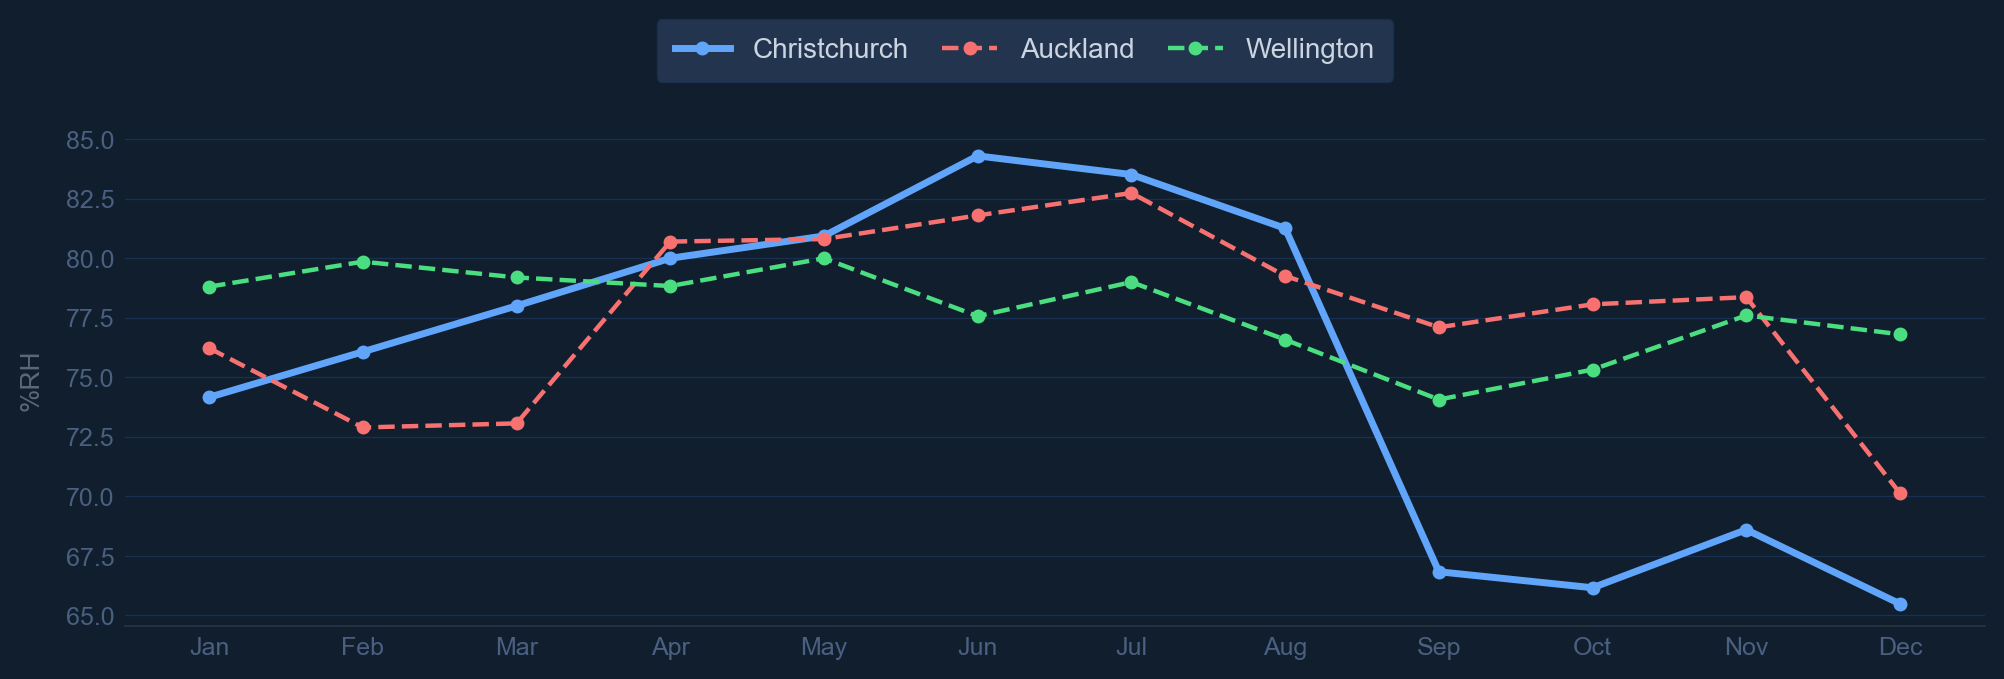
Monthly averages for Christchurch compared with Auckland, Wellington for climate comparison. Sourced from ERA5 reanalysis via Open-Meteo (12-month rolling).
 Sunshine Hours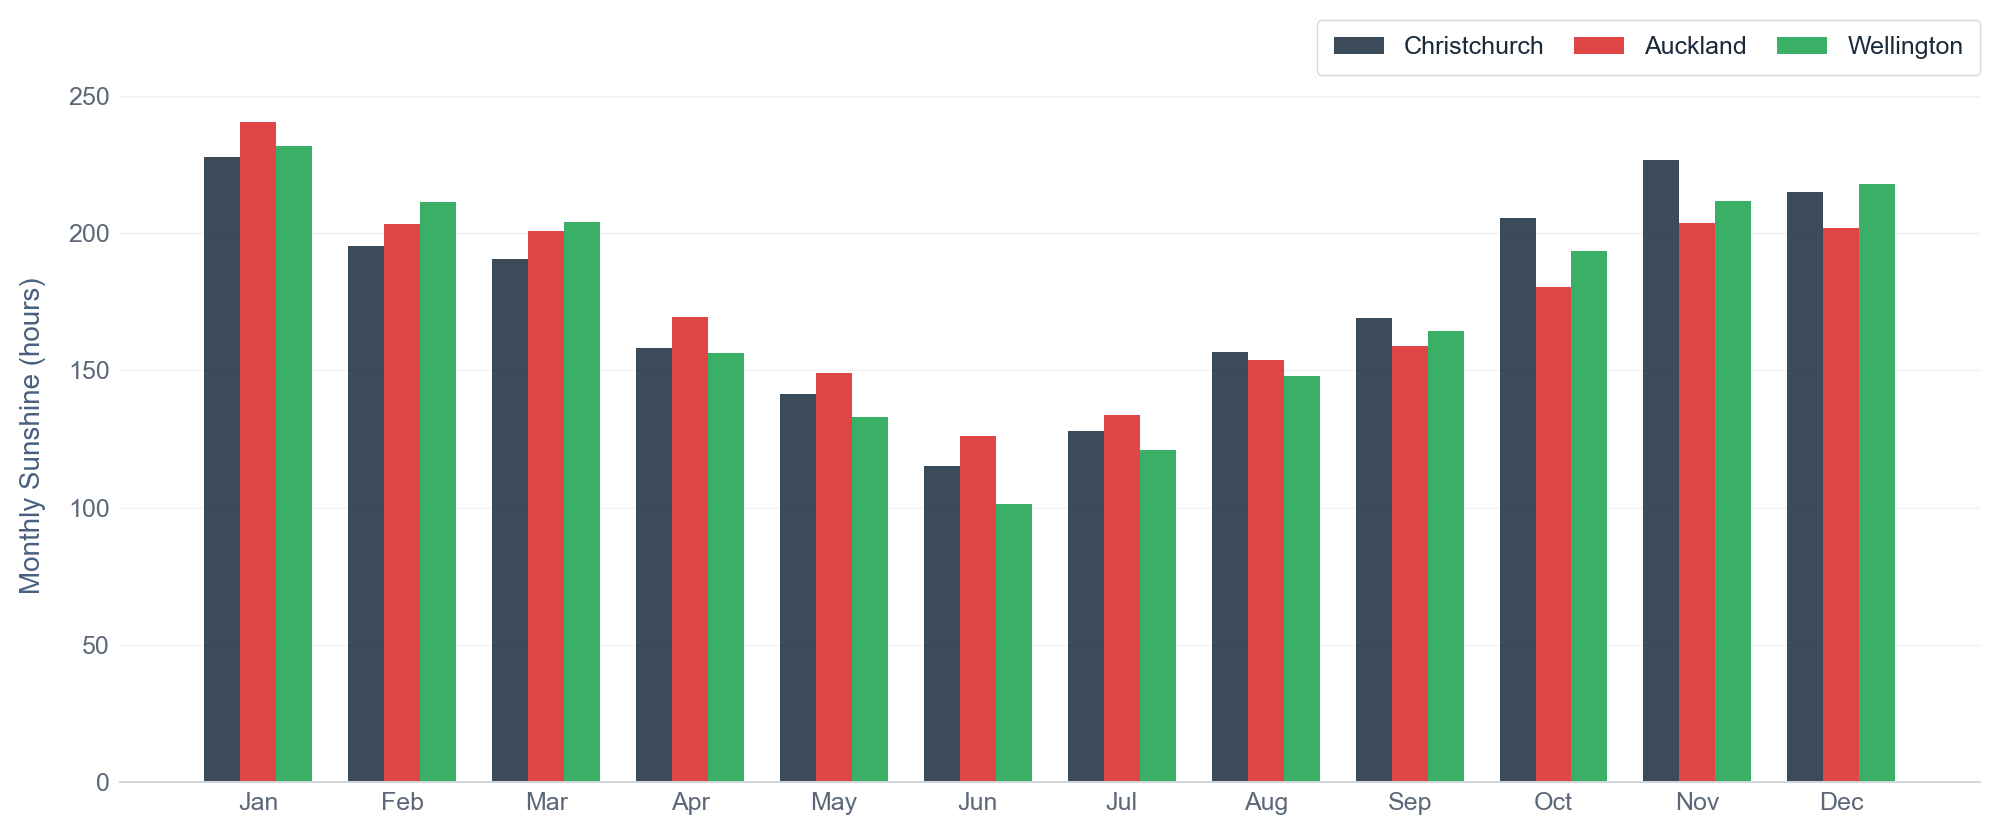
 Wind
Wind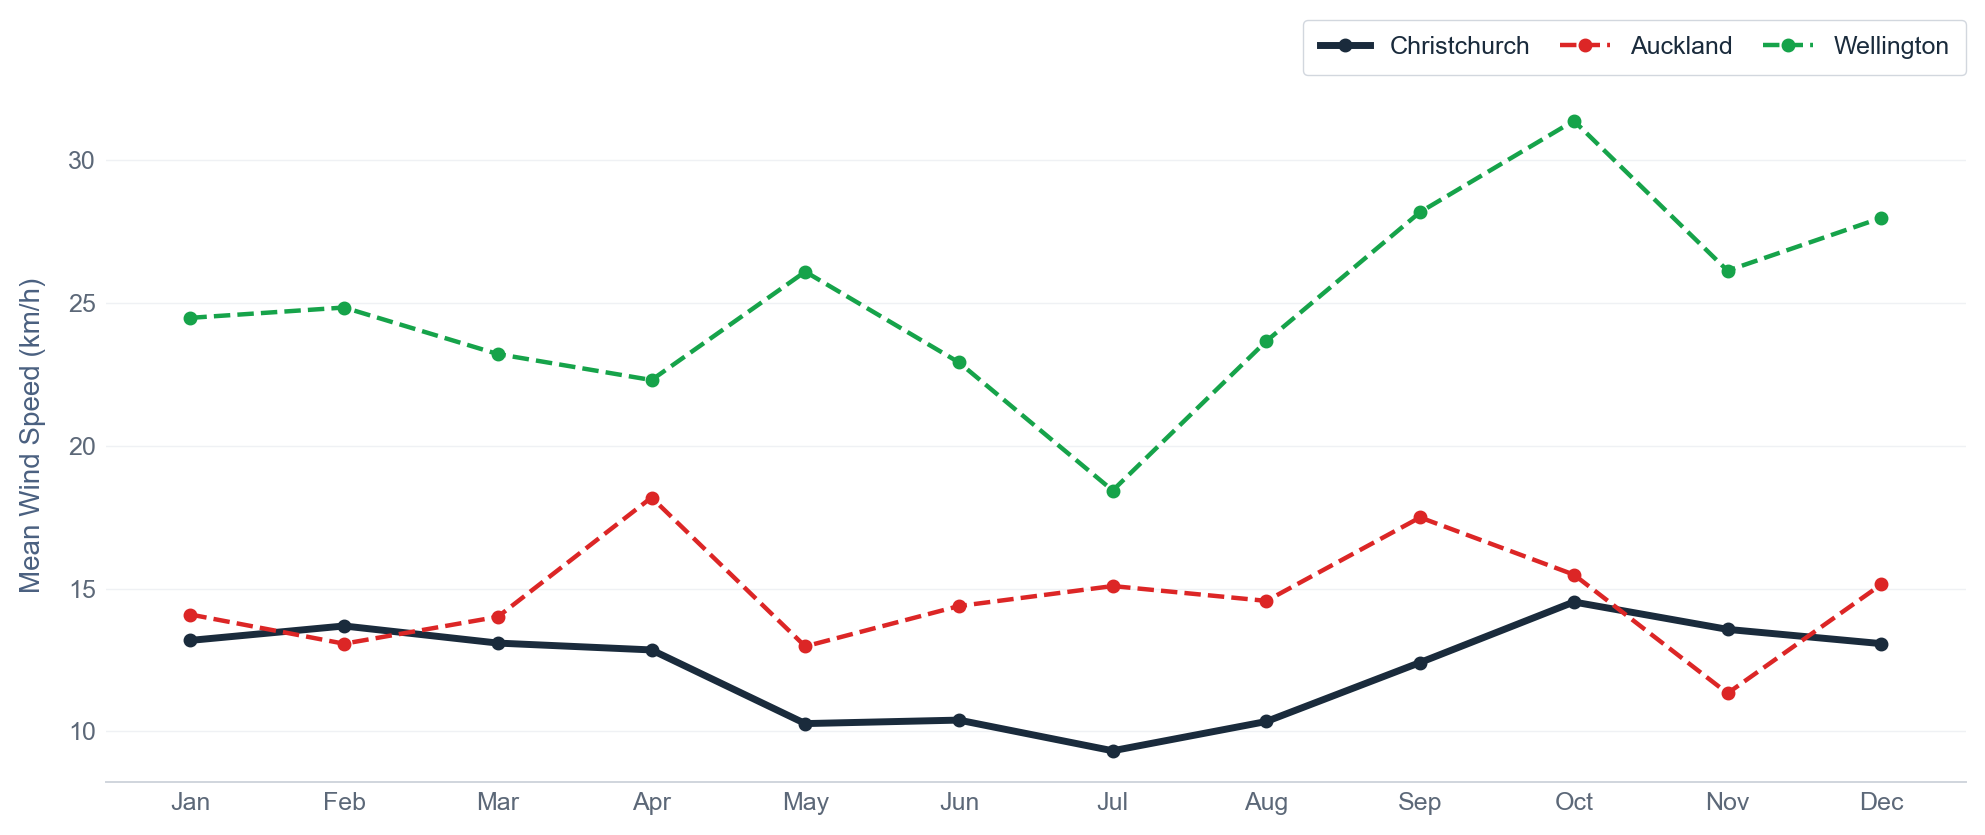
 UV Index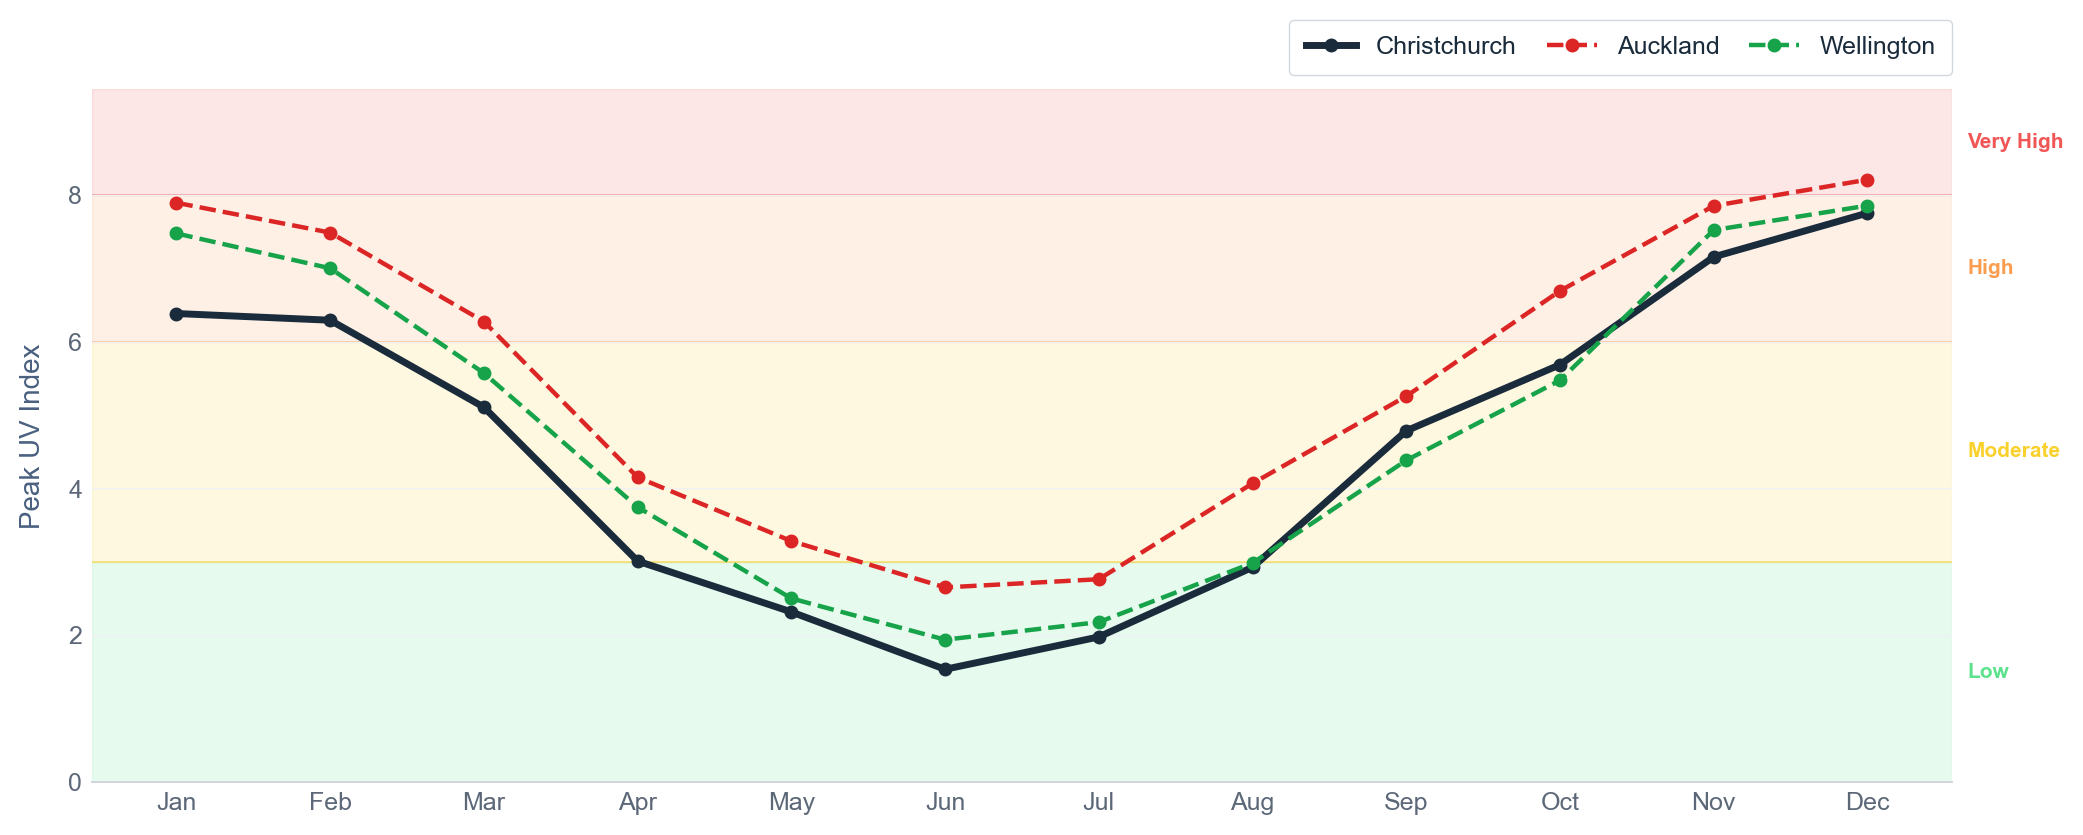
 Environmental Risks
Natural hazard data, geotechnical risk, and industrial pollution sources near this property.
Natural Hazard Insurance Claims
The Natural Hazards Commission Toka Tū Ake (formerly EQC) accepted 292 natural-hazard insurance claim(s) in Christchurch City over 2021–2025 — above the national average of 173 claims per district. The most common cause was landslip. This reflects how often homes in this district have been damaged by earthquake, flood, landslip or storm severe enough to claim.
 Industrial Discharge Consents
This section lists active resource consents held by businesses and organisations to discharge contaminants to air or water near this property. A consent means the discharge is authorised and regulated — but it is still relevant when evaluating air quality and water quality risks. Data from Environment Canterbury (ECan) consent register.
Fine dust and soot from burning, blasting, and grinding. Particles small enough to enter the lungs cause inflammation and cardiovascular stress.
Volatile organic compounds from spray painting, surface coating and printing. React with sunlight to form ground-level ozone.
Hydrogen sulphide and ammonia from wastewater treatment, composting and rendering. Cause significant nuisance at ambient concentrations.
Sulphur dioxide, nitrogen oxides and carbon monoxide from combustion sources. Precursors to smog and acid rain.
Heavy metals from smelting, electroplating and surface treatment. Accumulate in soil and food chains.
Where no specific contaminant is listed, the consent type indicates a combustion source (boiler, kiln, large-scale burner).
Source: Environment Canterbury (ECan) resource consent register (updated nightly).
This list covers consented discharges only. Unauthorised discharges and historical contamination are separate matters — check council LLUR/SLUR registers and request a LIM report before purchasing.
 The Great Outdoors
 Waterways & Coast
Marine & Coastal
Nearby surf spots, boat ramps, marine protected areas, and coastal water quality. Always verify current conditions before fishing, diving, or surfing.
Marine & Coastal Map
 17 Harrow Street
Full interactive maps: DOC marine reserves ↗ · Auckland Safeswim ↗
Surf spots: OpenStreetMap + SpotCheck known NZ breaks reference list. Beaches: OpenStreetMap. Boat ramps from OpenStreetMap + Google Places. Marine reserves from DOC (Marine Reserves Act 1971). Coastal water quality from Auckland Safeswim or LAWA freshwater monitoring network. Search radius: 10 km.
 Swimming Spots
Nearby lakes and swimming sites. Dot colour shows water quality grade — click a spot for details.
17 Harrow Street
| Place | Category | Distance |
|---|---|---|
| Avon River Kerrs Reach | Swimming Spot | 2.5 km |
| Avon Heathcote Estuary Humphreys Drive | Swimming Spot | 3.5 km |
| Avon Heathcote Estuary Mt Pleasant Yacht Club | Swimming Spot | 4.3 km |
| Avon Heathcote Estuary South New Brighton Park | Swimming Spot | 5.2 km |
| Avon-Heathcote Estuary Beachville Rd jetty | Swimming Spot | 6.0 km |
Lake data from OpenStreetMap. Motor restriction rules from NZ regional council bylaws. Water quality from LAWA (Land Air Water Aotearoa) where available. Fish species from curated NZ lake reference data and Fish & Game NZ. Always verify current access and conditions with the relevant regional council.
 Adventure Sports & Alpine Recreation
Ski fields, climbing venues and parks within 200 km of this property. Click any dot for details, or use the chips above the map to show a single category.
Distances are as-the-crow-flies. Check operator websites for current season, conditions, and pricing.
 Mosquito Index
Estimated mosquito level, the species found in this area, and the viruses they can carry — based on regional climate, nearby water bodies and known species distribution.
- Tip out and scrub containers weekly — pot-plant saucers, buckets, tyres, bird baths and blocked gutters are the main backyard breeding sites.
- Use an insect repellent containing DEET or picaridin on exposed skin when you're outdoors at dawn and dusk.
- Mosquitoes here are mainly a nuisance — repellent and emptying standing water around the property are usually enough.
Sources: NZ BioSecure Entomology Laboratory species profiles · ESR notifiable disease surveillance · Ministry for Primary Industries / Biosecurity New Zealand · OpenStreetMap wetland features.
 Community
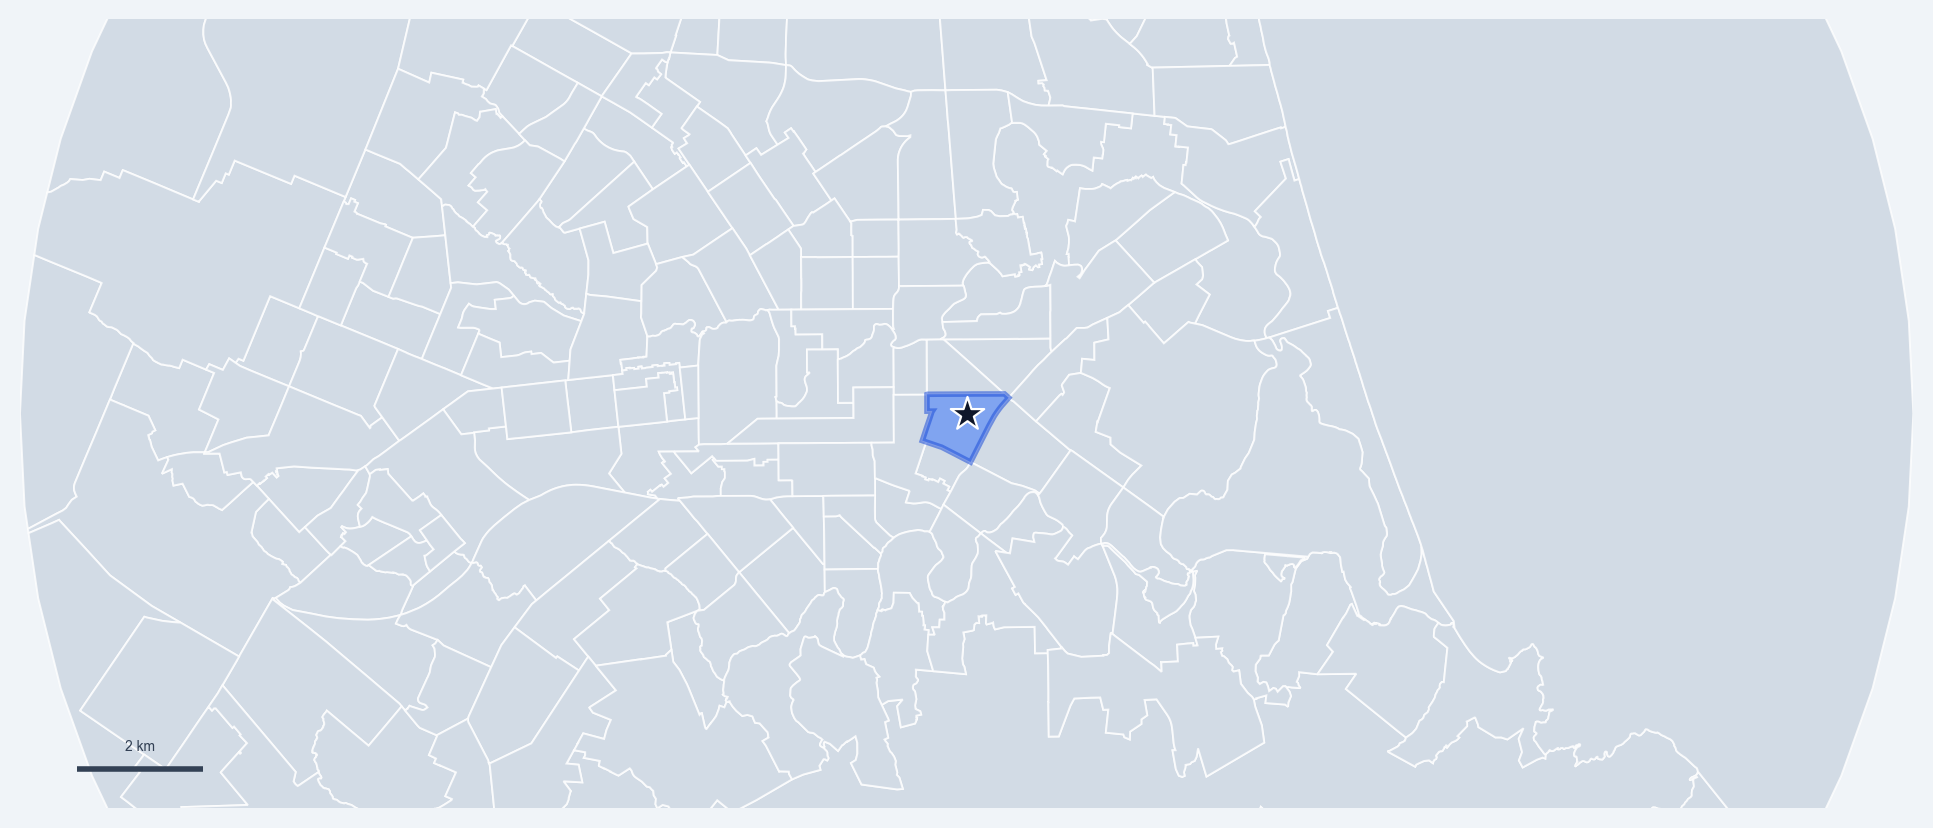
Te Waka Unua School, a Primary school, is located 1.3 km from the property, making it accessible for families with younger children in the area. This proximity supports convenient school drop-offs and pick-ups for residents with primary-age dependents. The Ōtautahi Sports Association is situated just 0.3 km away, while the Phillipstown Community Hub and Aviva community centre are both within 0.8 km of the property. These facilities provide residents with immediate access to recreational, social, and community services that support daily engagement and neighbourhood cohesion.
 Local Demographics
 Local Area Demographics
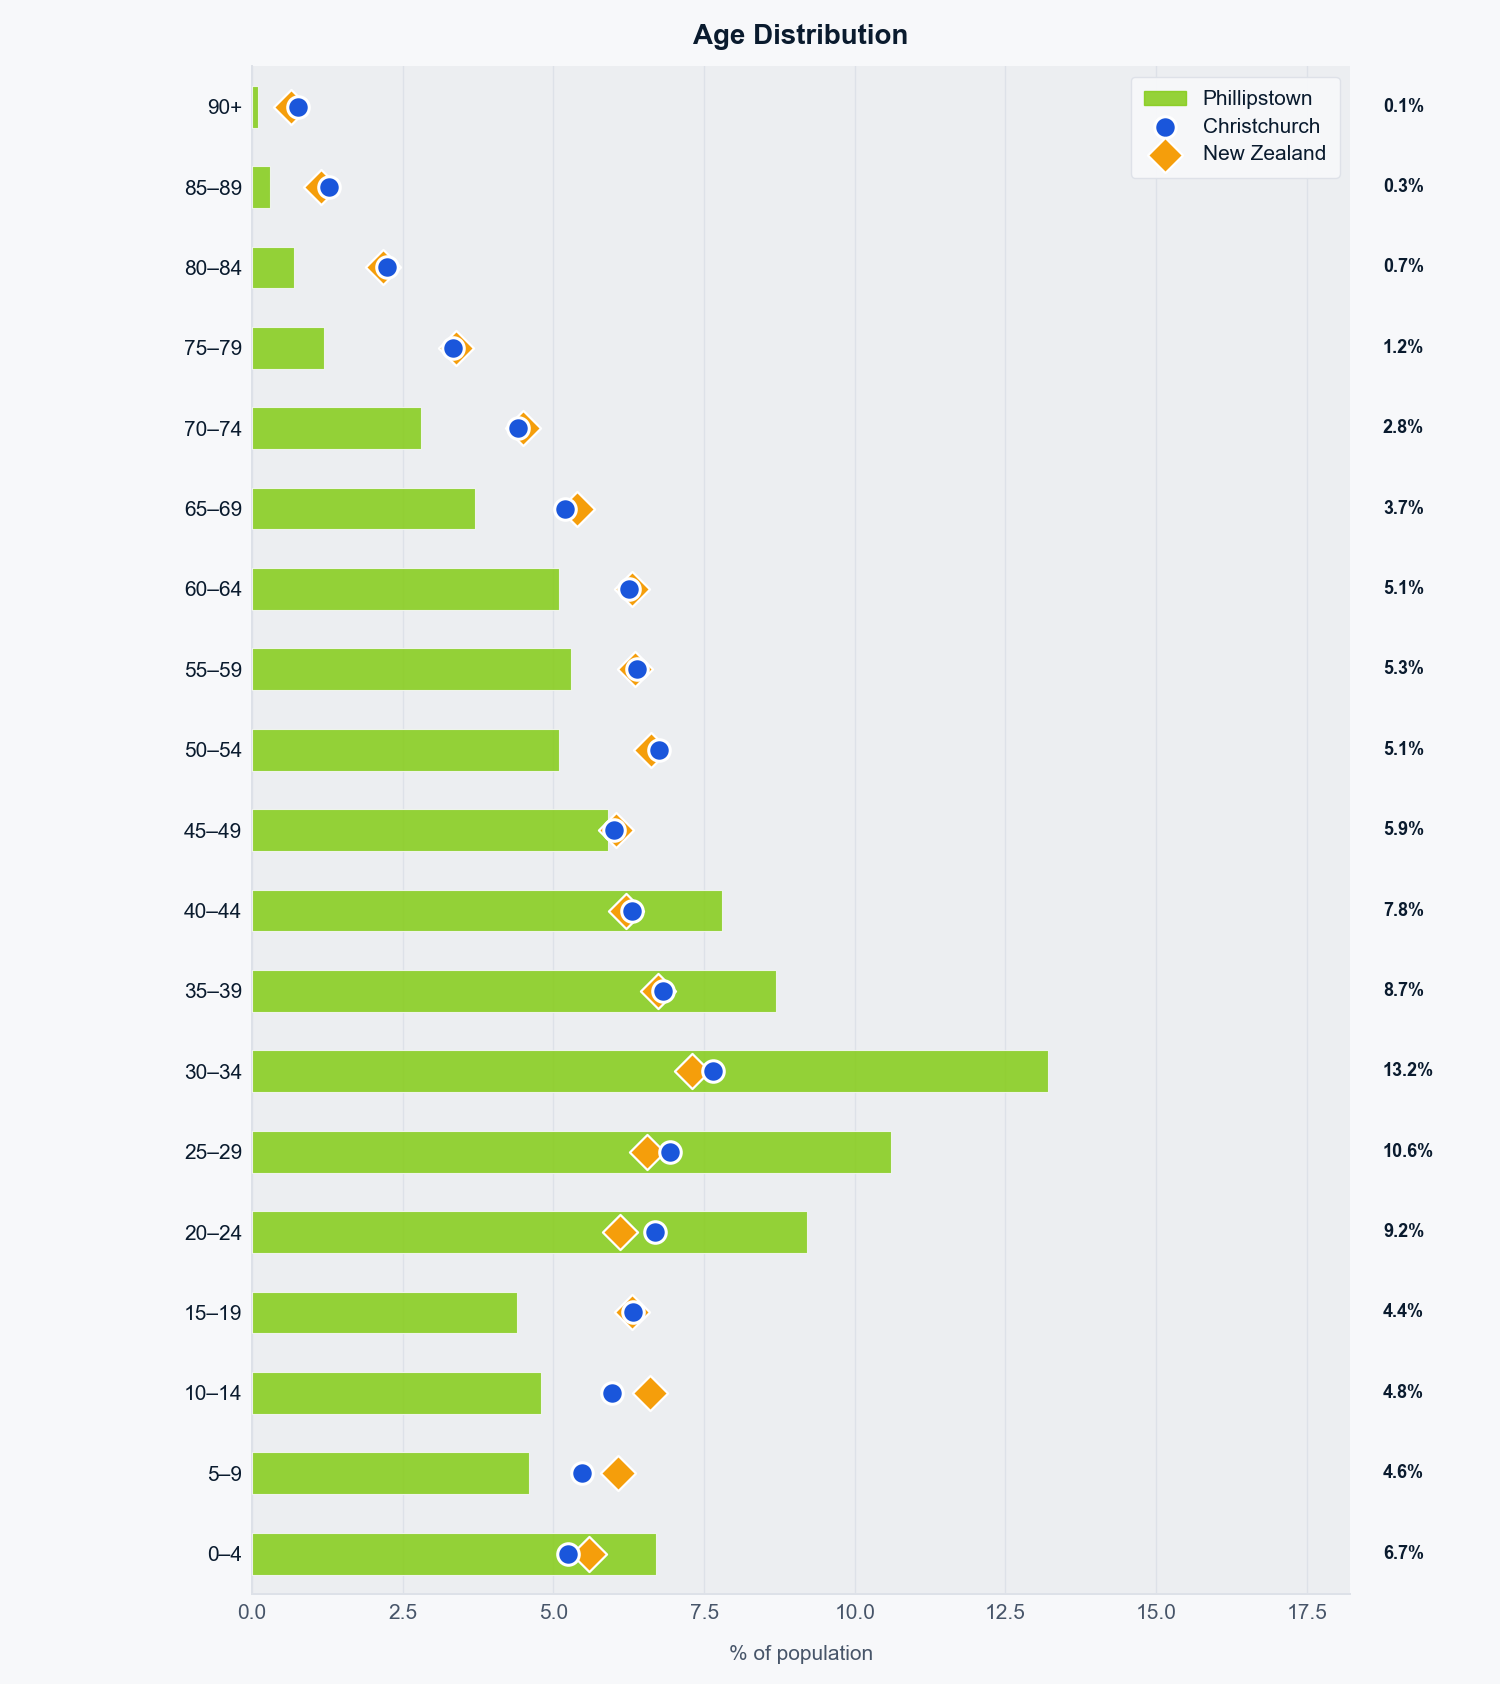
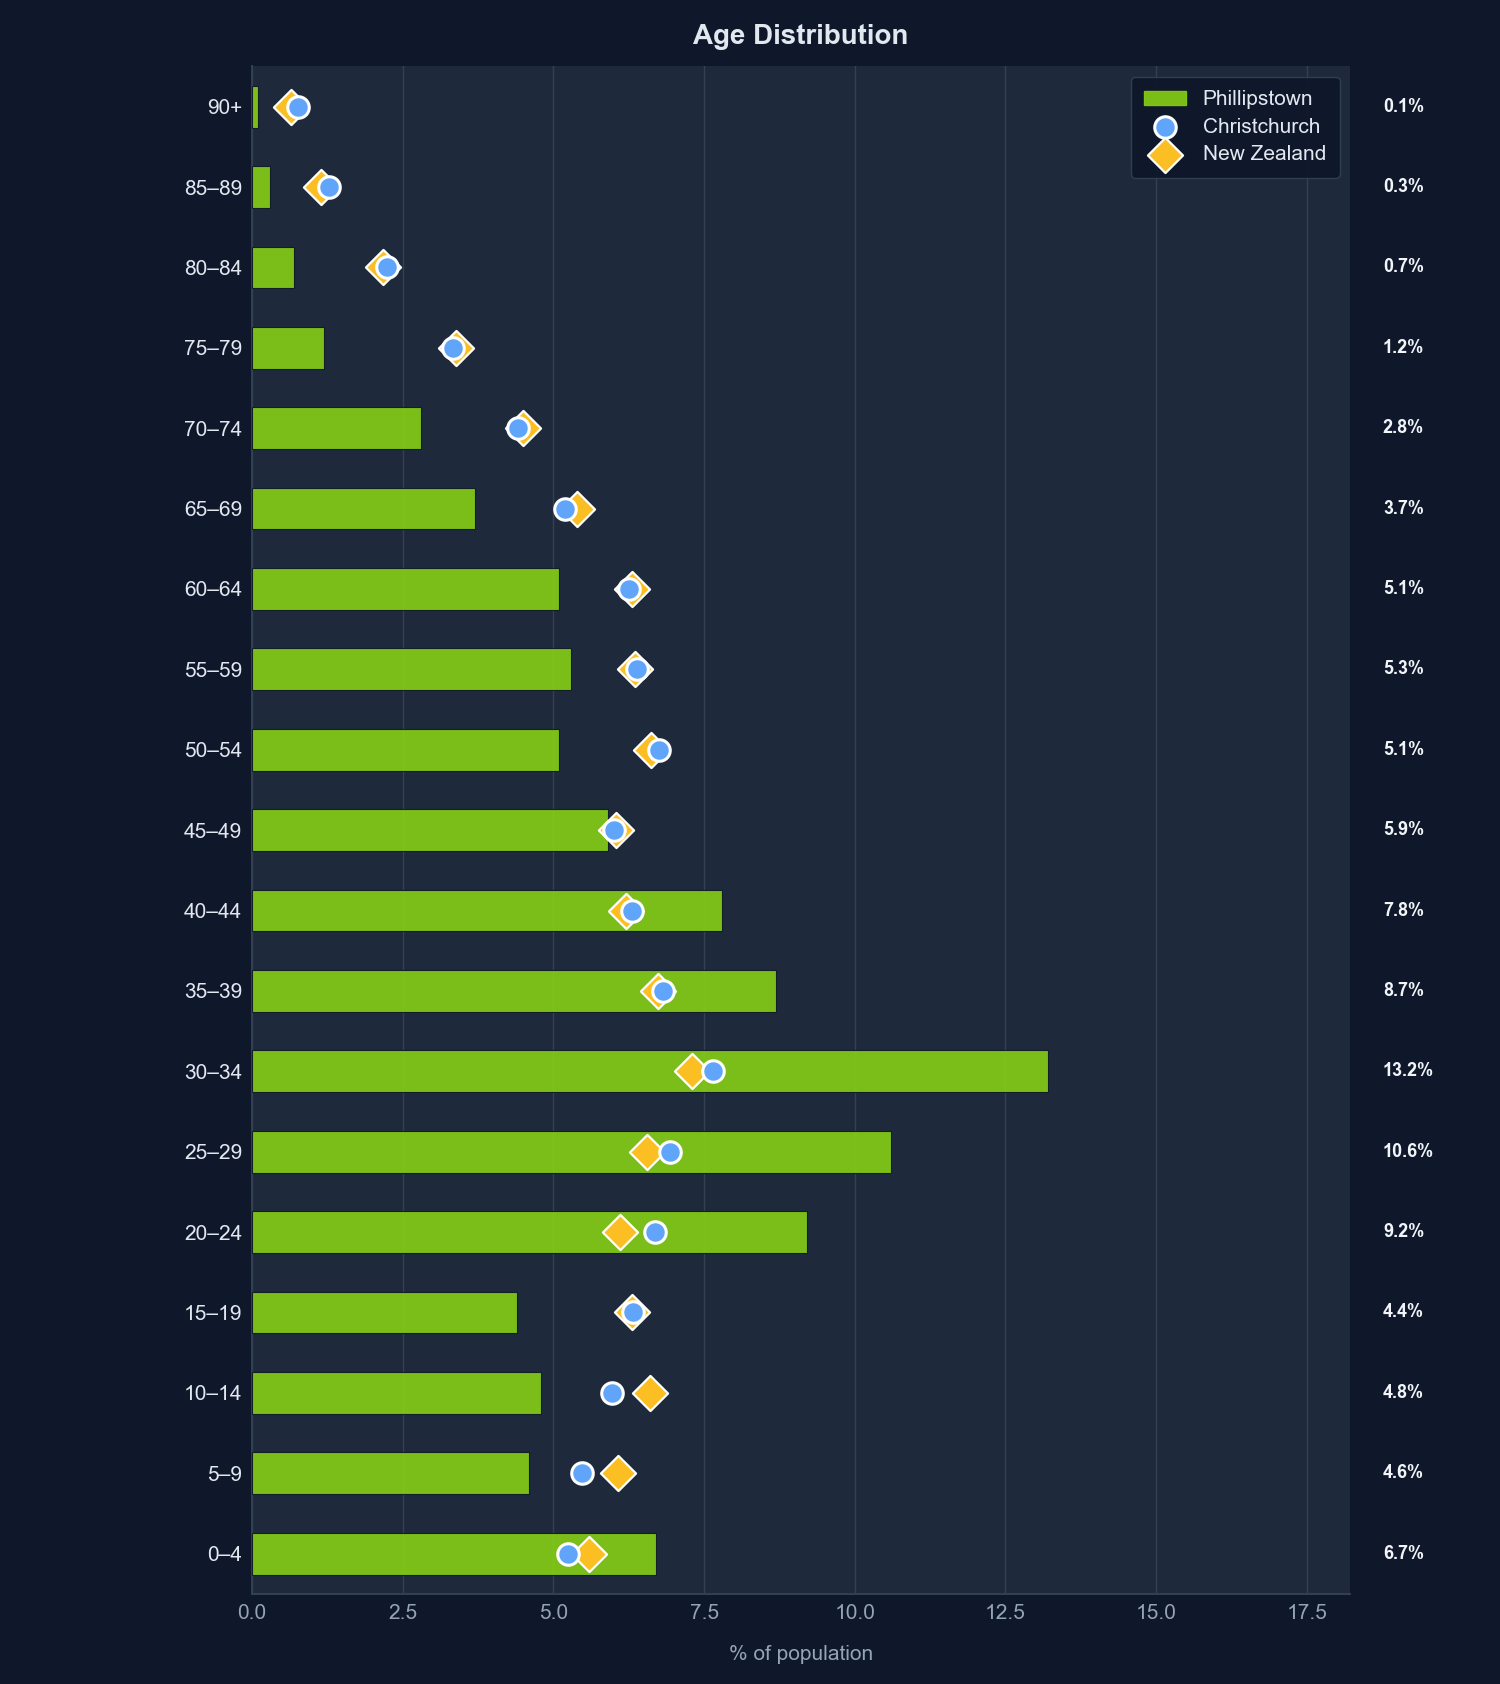
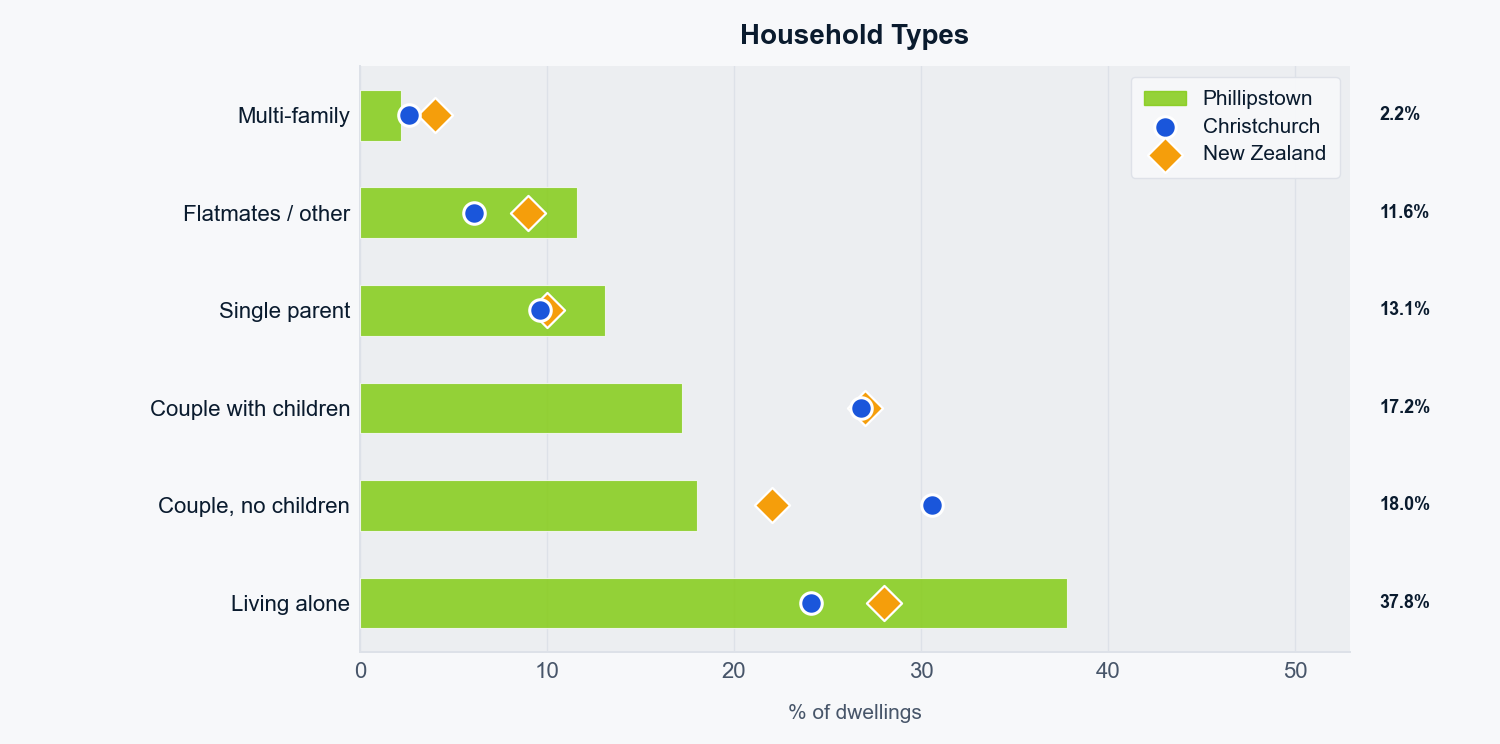
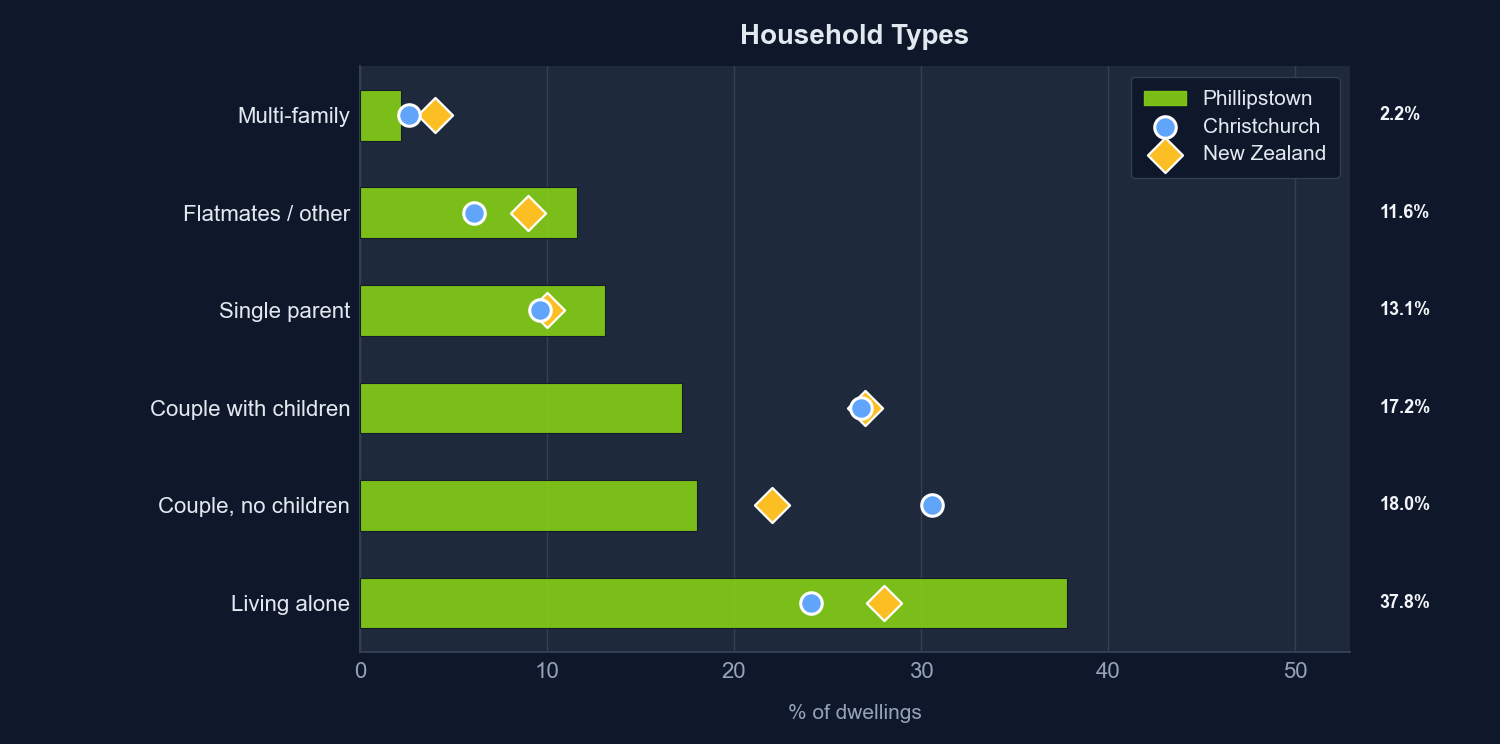
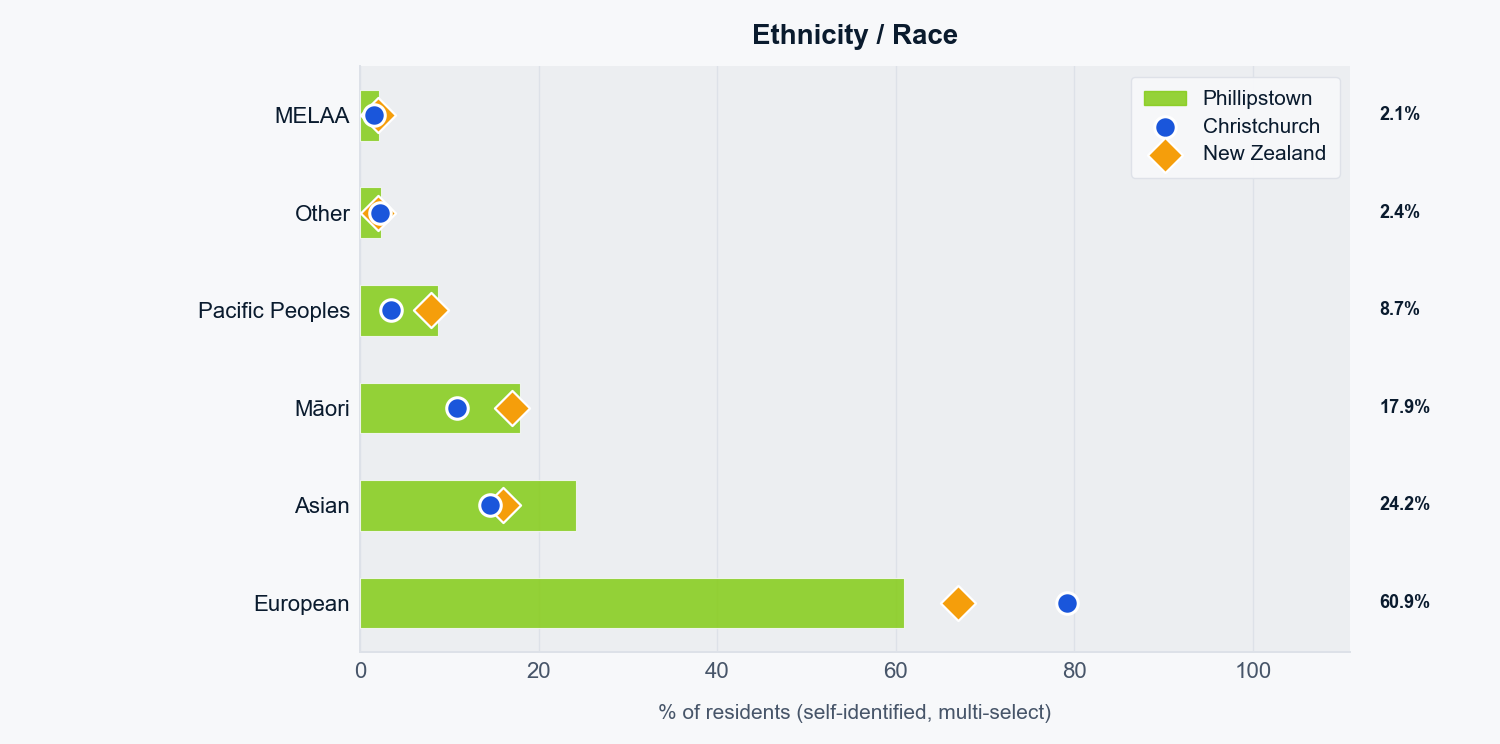
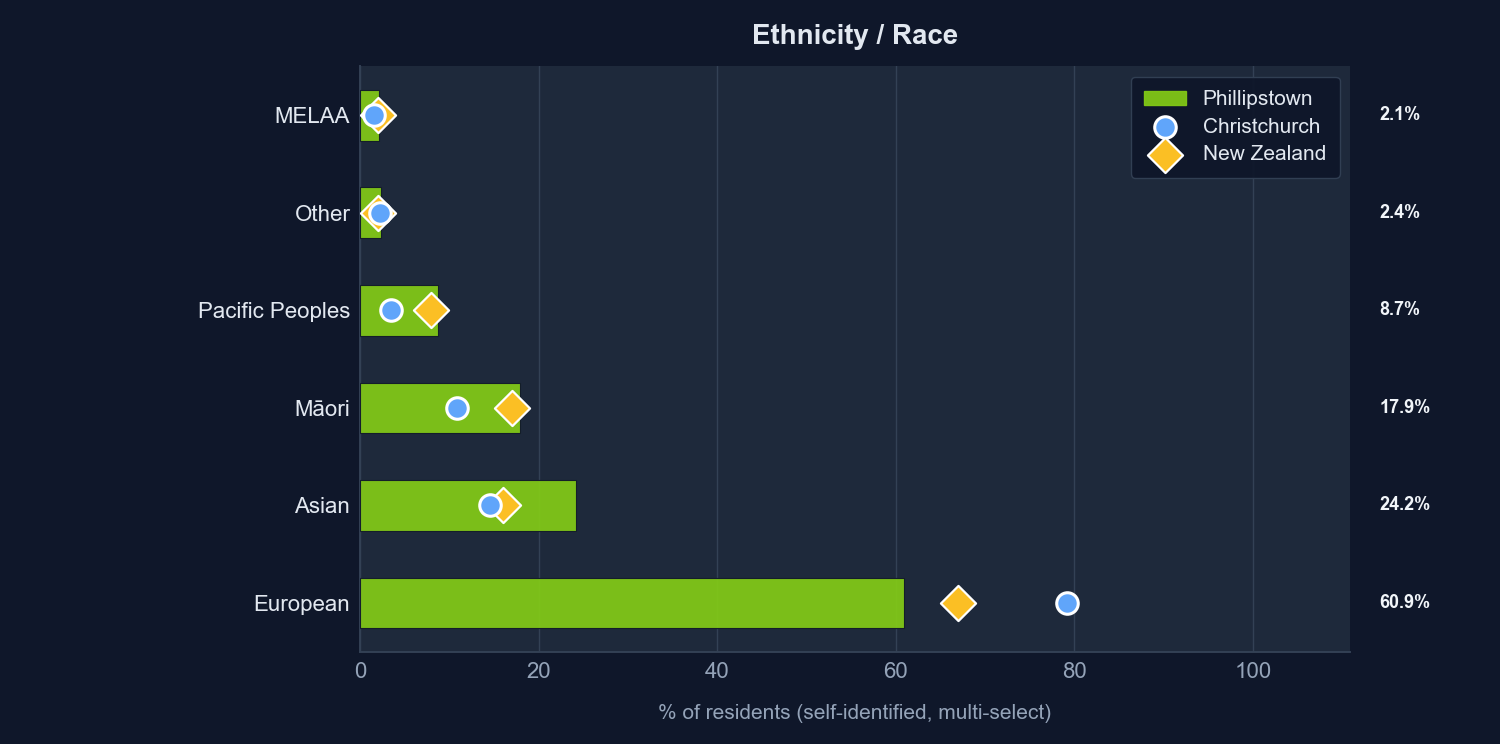
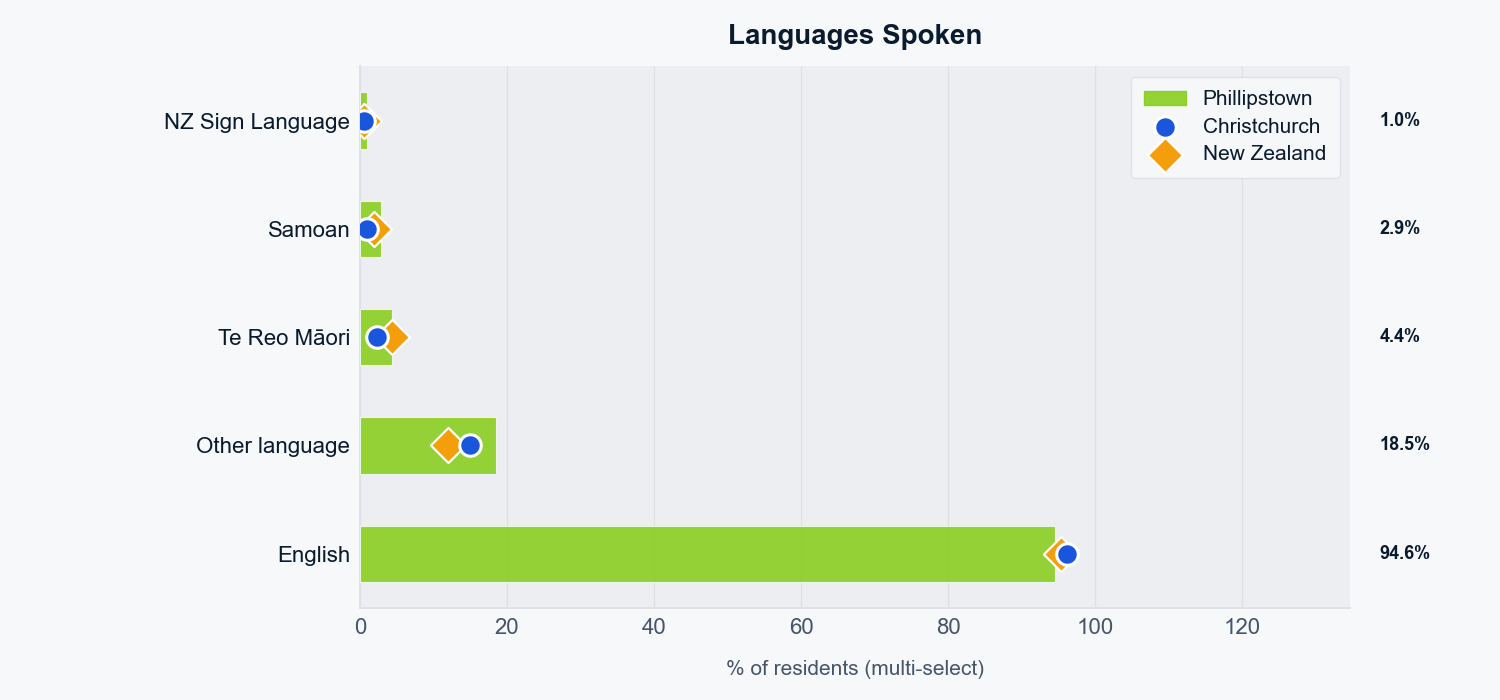
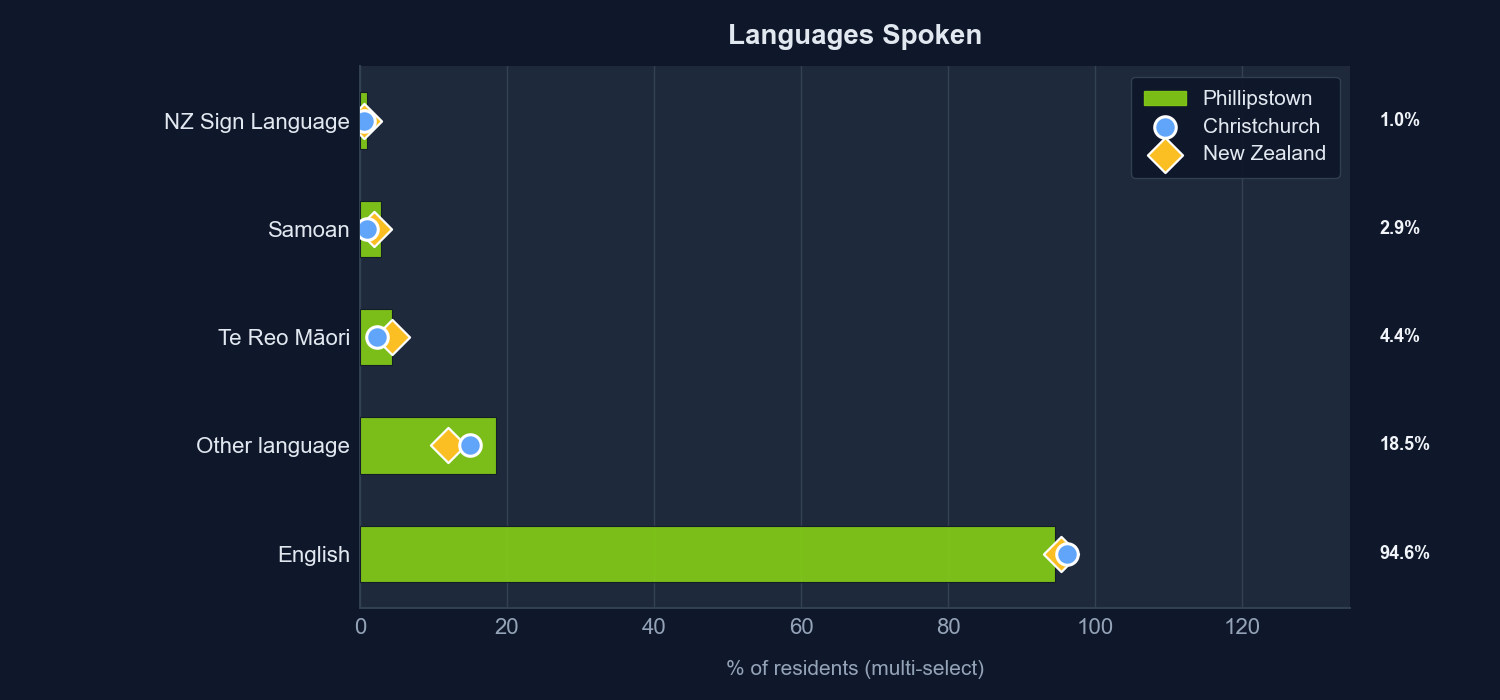
Phillipstown has a notably younger demographic profile than the city average, with a median age of 34 years compared to 40 years across Christchurch. The area is heavily weighted toward renters (64% versus 69% owner-occupied city-wide) and skews toward families with children, who comprise 63% of households against 37% couples without children. This profile indicates a transient, family-oriented suburb with fewer established owner-occupiers than the broader urban area.
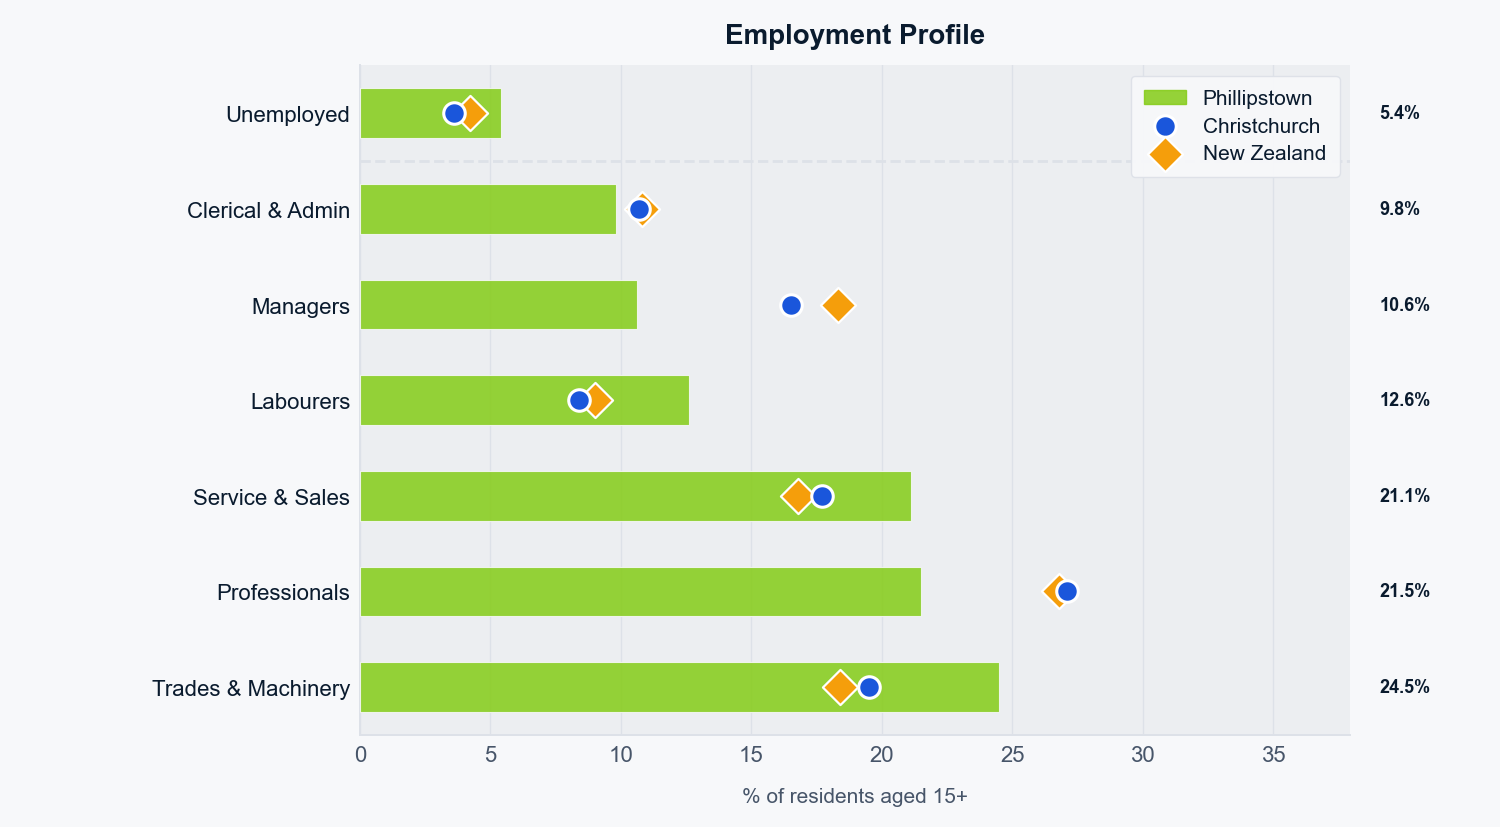
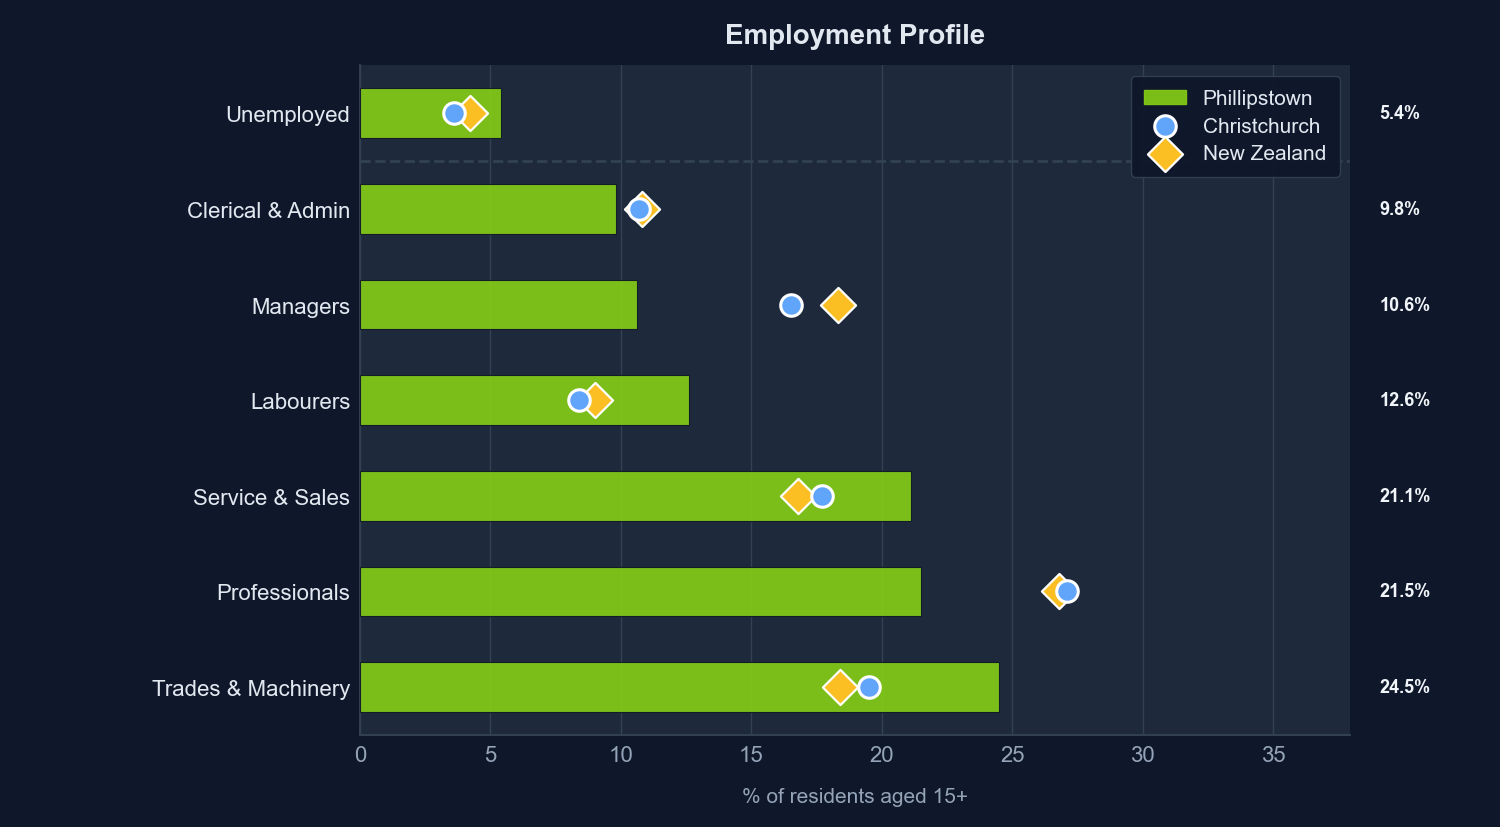
The median personal income of $38,400 annually falls below the city average of $42,461, and degree-qualified residents represent 24% of the population against 27% city-wide. Employment is distributed across skilled trades (24%), professionals (22%), service roles (21%), and management (11%), suggesting a working-class to lower-middle-class demographic with practical and service-sector representation. These statistics describe the suburb at the statistical area level; individual household circumstances will vary considerably within the area.
Cost of Living
Crowd-sourced · Numbeo ↗| Christchurch | Auckland | Wellington | |
|---|---|---|---|
| Meal out | NZ$25 | NZ$25 | NZ$25 |
| Monthly transport | NZ$180 | NZ$217 | NZ$181 |
| Utilities/month | NZ$285 | NZ$314 | NZ$349 |
| Avg net salary | NZ$4,778 | NZ$5,444 | NZ$4,888 |
Source: Stats NZ 2023 Census at Statistical Area 2 (SA2) level. Occupation: ANZSCO major groups of employed residents aged 15+. Area-level statistics — individual households will vary.
 Health Services
 Health Services
Nearby health facilities including hospitals, GPs, dentists, pharmacies, physiotherapists, and optometrists. Distances are straight-line; actual travel time will vary. Always verify opening hours directly with the clinic. Hospital search radius: 25 km. All other services: 5 km.
Health Services Map
17 Harrow Street
| Place | Category | Distance |
|---|---|---|
| Rannerdale War Vets Home | GP / Medical Centre | 7.2 km |
| Rosewood Rest Home & Hospital | Hospital | 1.7 km |
| Forte Health | Hospital | 2.4 km |
| 24 Hour Surgery | Hospital | 2.5 km |
Health facility data from OpenStreetMap and Google Places. Search radius 5 km. Orthodontist classification based on name and speciality tags — verify directly. For emergencies, call 111. For after-hours medical advice, call Healthline 0800 611 116.
 Politics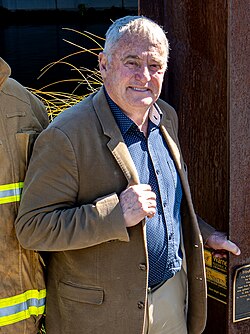
Philip Simon Mauger (born c. 1958) is a politician and former businessman who has served as the Mayor of Christchurch since 2022.
Politics — Electorate: Christchurch Central

 Labour
Elected 2023 with 39.7% of the candidate vote
Labour
Elected 2023 with 39.7% of the candidate vote
Christchurch Central electorate boundary · © OpenStreetMap contributors
How this general electorate has voted at the last 2 New Zealand general elections. Electorate MPs are decided by the candidate vote; party vote determines the make-up of Parliament under MMP.
| Year | Electorate MP (candidate vote) | Party Vote winner |
|---|---|---|
| 2023 | Duncan Webb Labour39.7% majority 1,841 | National31.1% |
| 2020 | Duncan Webb Labour59.3% majority 14,098 | Labour53.2% |
Source: NZ Electoral Commission via Wikipedia electorate pages.
Source: Wikipedia — Opinion polling for the 2026 New Zealand general election. Monthly averages of all polls from Curia, Roy Morgan, Verian/Colmar Brunton, Reid Research, Talbot Mills and others. ◆ = official 2023 election result.
 Education
Education
State schools are free for NZ citizens, permanent residents, and most children whose parent holds a work or skilled-migrant visa of 2+ years. Children on visitor visas or shorter-term permits are classified as international students and pay fees — typically $13,000–$17,000 per year at state schools. Not every school can take international students: only those that are signatories to the NZQA Code of Practice may enrol them — these are marked “International students” below, with the typical fee band. Check your visa conditions before assuming your children will enrol for free.
Ministry of Education — international student enrolment ↗The Equity Index replaced the old decile system in January 2023. Each state school receives a score from roughly 344 to 569. A higher EQI means the school's community faces more socioeconomic barriers — and the school receives more government funding to address this. A lower EQI indicates a more advantaged community and therefore less additional government support.
Important: The EQI does not measure school quality, academic achievement, or teaching effectiveness. Many high-EQI schools deliver outstanding outcomes for their students. Always read the school's ERO review and visit in person before drawing conclusions.
New Zealand state and state-integrated schools cannot charge compulsory fees, but most ask for a voluntary school donation — typically $100–$400 per year per child. These donations are used for extras the government doesn't fully fund: stationery, reading resources, cultural events, and specialist equipment. You are never legally required to pay, and your child cannot be excluded or disadvantaged for not paying.
Schools with a lower EQI (more advantaged communities) tend to request higher donations and raise more through them — sometimes topping up resources significantly. Schools with a higher EQI rely more heavily on government equity funding. State-integrated schools (often religious) may also charge attendance dues ($200–$1,500+ per year) which contribute to property and character costs — these are set by the school's proprietor.
17 Harrow Street
| Place | Category | Distance |
|---|---|---|
| Kimihia Early Learning Centre | 20 hrs free ECE | 0.3 km |
| Kidsfirst Kindergartens Phillipstown | 20 hrs free ECE | 0.5 km |
| New Beginnings Pre-School | 20 hrs free ECE | 0.5 km |
| Kidsfirst Kindergartens Linwood | 20 hrs free ECE | 0.8 km |
| Te Kōhanga Reo o Te Hohepa | 20 hrs free ECE | 0.8 km |
| Tiny Tots Preschool | 20 hrs free ECE | 0.8 km |
17 Harrow Street
| Place | Category | Distance |
|---|---|---|
| Te Waka Unua School | State | 1.3 km |
| School | Zone | Sector | Equity Index | Distance |
|---|---|---|---|---|
Te Waka Unua SchoolDomestic only 485 students · Est. 2015 · 11 years Te reo Māori (bilingual) ▬ -1.8%roll 490→481 (2021–2025) European / Pākehā 31%Māori 36%Pacific 17%Asian 13% ERO · Profile Report10 Oct 2023 Te Ara Huarau | School Profile Report Background This Profile Report was written within 19 months of the Education Review Office and Te Waka Unua School working in Te Ara Huarau , an improvement evaluation approach used in most English Medium State and State Integrated Schools. For more information about Te Ara Huarau… | In zone | State | 509 High needs community | 1.3 km |
17 Harrow Street
| Place | Category | Distance |
|---|---|---|
| Te Oraka | State | 3.1 km |
| School | Sector | Equity Index | Distance |
|---|---|---|---|
Te OrakaDomestic only 192 students · Est. 1934 · 92 years Te reo Māori (bilingual) ▲ +29.6%roll 152→197 (2021–2025) European / Pākehā 52%Māori 26%Asian 12% ERO · ERO review27 Oct 2023 1 Findings Shirley Intermediate has made significant progress in relation to the priorities identified in this report. Leaders, staff, and the board are aware of the need to sustain momentum for improving the school’s performance for its learners and their community. 2 Background and Context What is the background and… | State | 505 High needs community | 3.1 km |
17 Harrow Street
| Place | Category | Distance |
|---|---|---|
| Christ's College | Private | 3.1 km |
| Rangi Ruru Girls' School | Private | 4.2 km |
| New Zealand IT College (Proposed) | Private | 4.9 km |
| Te Aratai College | State | 0.3 km |
| Catholic Cathedral College | State-Integrated | 1.5 km |
| St Bede's College | State-Integrated | 6.9 km |
| Marian College | State-Integrated | 7.0 km |
| Villa Maria College | State-Integrated | 7.9 km |
| School | Sector | Equity Index | Distance |
|---|---|---|---|
Te Aratai CollegeDomestic only 1,276 students · Est. 1954 · 72 years ▲ +71.1%roll 754→1290 (2021–2025) European / Pākehā 43%Māori 23%Pacific 12%Asian 19% ERO · Evaluation Report06 Oct 2025 About the school Te Aratai College, formerly Linwood College, is a co-educational state school for students in Years 7 to 13 in Christchurch. The school roll is 1340, 29% of students identify as Māori , 57% NZ European/ Pakeha , 22% Asian and 13% of Pacific heritage. The school provides education for students with… | State | 507 High needs community | 0.3 km |
Catholic Cathedral CollegeInternational students 598 students · Est. 1868 · 158 years International fees typically $15,000–$25,000/year (state-integrated) (1 currently enrolled) · school site for exact fees ↗ ▲ +34.6%roll 442→595 (2021–2025) European / Pākehā 27%Māori 10%Pacific 13%Asian 46% ERO · Evaluation Report04 Sep 2025 About the school Catholic Cathedral College , located in Christchurch, is a Catholic state integrated co-educational secondary school for learners from Years 7 to 13. The school’s values are: Whakapono | Having faith and trust in God and in each other; Whanaungatanga | A sense of family and working together to provide… | State-Integrated | 448 Moderate needs | 1.5 km |
Christ's CollegeInternational students 708 students · Boys School · Est. 1858 · 168 years Boarding available International fees typically $25,000–$45,000/year (private) (17 currently enrolled) · school site for exact fees ↗ ▲ +6.7%roll 685→731 (2021–2025) European / Pākehā 78%Asian 13% ERO · Private School Review Report07 Mar 2024 Introduction ERO reviews of private schools are significantly different in process and more limited in scope and reporting than those for state and state-integrated schools, focusing as they do on the Criteria for Registration set out in clauses 2 to 6, Schedule 7 of the Education and Training Act 2020. Clause 9,… | Private | — | 3.1 km |
Rangi Ruru Girls' SchoolInternational students 705 students · Girls School · Est. 1889 · 137 years Boarding available International fees typically $25,000–$45,000/year (private) (16 currently enrolled) · school site for exact fees ↗ ▲ +4.5%roll 674→704 (2021–2025) European / Pākehā 77%Asian 14% ERO · ERO review11 Nov 2024 Introduction ERO reviews of private schools are significantly different in process and more limited in scope and reporting than those for state and state-integrated schools, focusing as they do on the Criteria for Registration set out in clauses 2 to 6, Schedule 7 of the Education and Training Act 2020. Clause 9,… | Private | — | 4.2 km |
New Zealand IT College (Proposed)Domestic only | Private | — | 4.9 km |
St Bede's CollegeInternational students 811 students · Boys School · Est. 1911 · 115 years Boarding available International fees typically $15,000–$25,000/year (state-integrated) (26 currently enrolled) · school site for exact fees ↗ ▬ -0.4%roll 816→813 (2021–2025) European / Pākehā 69%Māori 12%Asian 11% ERO · Evaluation Report30 Oct 2025 About the school St Bede’s College a state integrated school located in Christchurch, provides education within the Marist and Catholic traditions for boys in Years 9 to 13. Residential boarding facilities for local and international students are provided onsite. Four key priorities are woven through, and underpin,… | State-Integrated | 415 Moderate needs | 6.9 km |
Marian CollegeInternational students 436 students · Girls School · Est. 1982 · 44 years International fees typically $15,000–$25,000/year (state-integrated) (3 currently enrolled) · school site for exact fees ↗ ▲ +4.5%roll 399→417 (2021–2025) European / Pākehā 67%Māori 11%Pacific 9%Asian 11% NCEA attainment (school leavers) Level 294.5% (2024)▲ 18 pts vs 76.1% national96.8 → 95.2 → 94.5 NCEA data & subjects ERO · Evaluation Report06 May 2025 Context Marian College is a Catholic state integrated secondary school for girls in Years 9 to 13. After the Christchurch earthquakes, the school was in temporary sites for over a decade. At the end of 2023 Marian College moved into a purpose-built new site in Papanui , Christchurch – Marian College at Māhutonga . The… | State-Integrated | 426 Moderate needs | 7.0 km |
Villa Maria CollegeInternational students 835 students · Girls School · Est. 1918 · 108 years International fees typically $15,000–$25,000/year (state-integrated) (23 currently enrolled) · school site for exact fees ↗ ▬ -0.4%roll 827→824 (2021–2025) European / Pākehā 62%Māori 11%Asian 17% NCEA attainment (school leavers) Level 1100% (2024)▲ 16 pts vs 84.2% national100 → 95.8 → 100 NCEA data & subjects ERO · Profile Report10 Oct 2023 Te Ara Huarau | School Profile Report Background This Profile Report was written within four months of the Education Review Office and Villa Maria College working in Te Ara Huarau , an improvement evaluation approach used in most English Medium State and State Integrated Schools. For more information about Te Ara… | State-Integrated | 411 Moderate needs | 7.9 km |


 17 Harrow Street
| Place | Category | Distance |
|---|---|---|
| Ara Institute of Canterbury | Tertiary institution | 1.4 km |
| University of Otago, Christchurch | Tertiary institution | 3.0 km |
| University of Canterbury | Tertiary institution | 6.7 km |
| Lincoln University | Tertiary institution | 19.8 km |
| Institution | QS World | Best ranked for | Students | Distance |
|---|---|---|---|---|
University of Otago, Christchurch Clinical and health-sciences campus | #197 | Dentistry (Top 100) | 1,300 | 3.0 km |
University of Canterbury Public research university | #261 | Civil and Structural Engineering (Top 100) | 21,000 | 6.7 km |
Lincoln University Specialist land-based university | #362 | Agriculture and Forestry (Top 50) | 3,800 | 19.8 km |
Ara Institute of Canterbury Institute of technology / polytechnic | Vocational | Nursing and Health | 17,000 | 1.4 km |
Overall position: QS World University Rankings 2026. Subject bands: QS World University Rankings by Subject. Vocational institutes are not covered by global research rankings.
 Things to Do
Things to Do
Local attractions, activities, and experiences within 21 km of this property. From hot pools and museums to wineries, adventure activities, and golf courses. Source: OpenStreetMap + Wikivoyage.
Things to Do
17 Harrow Street
| # | Place | Category | Distance | Map |
|---|---|---|---|---|
| 1 | Riccarton Bush | Adventure Activity | 5.6 km | 1 |
| 2 | Site of Canterbury Television building | Garden / Notable Park | 1.9 km | 1 |
| 3 | Christchurch Botanic Gardens | Garden / Notable Park | 3.6 km | 1 |
| 4 | Mona Vale | Garden / Notable Park | 4.8 km | 1 |
| 5 | Christchurch Adventure Park | Garden / Notable Park | 7.4 km | 1 |
| 6 | Garden City Helicopters | Garden / Notable Park | 10.6 km | 1 |
| 7 | midgetgolf | Golf Course | 2.9 km | 1 |
| 8 | Linwood Community Arts Centre | Museum / Gallery | 0.8 km | 1 |
| 9 | Flare | Museum / Gallery | 2.3 km | 1 |
| 10 | The Piano | Museum / Gallery | 2.3 km | 1 |
| 11 | Our City O-Tautahi | Museum / Gallery | 2.6 km | 2 |
| 12 | Quake City | Museum / Gallery | 2.7 km | 2 |
| 13 | Canterbury Museum Pop-Up | Museum / Gallery | 2.7 km | 2 |
| 14 | Christchurch Art Gallery | Museum / Gallery | 2.8 km | 2 |
| 15 | Teece Museum of Classical Antiquities | Museum / Gallery | 3.0 km | 2 |
| 16 | Air Force Museum | Museum / Gallery | 9.5 km | 2 |
| 17 | Cardboard Cathedral | Theme Park / Attraction | 1.8 km | 2 |
| 18 | SALT District | Theme Park / Attraction | 1.9 km | 2 |
| 19 | Ōtautahi | Theme Park / Attraction | 2.0 km | 2 |
| 20 | Stranges Lane | Theme Park / Attraction | 2.1 km | 2 |
| 21 | Ko Tāne | Theme Park / Attraction | 2.4 km | 3 |
| 22 | St Michael and All Angels Church | Theme Park / Attraction | 2.6 km | 3 |
| 23 | T-Rex Ride | Theme Park / Attraction | 2.7 km | 3 |
| 24 | Dino Dig | Theme Park / Attraction | 2.7 km | 3 |
| 25 | Centre of Contemporary Art | Theme Park / Attraction | 2.7 km | 3 |
| 26 | Sign of Walkway | Zoo / Animal Park | 5.6 km | 3 |
| 27 | Willowbank Wildlife Reserve | Zoo / Animal Park | 9.9 km | 3 |
| 28 | Orana Wildlife Park | Zoo / Animal Park | 18.0 km | 3 |
Transportation
Getting around — nearby stops and stations, travel times to the city centre, and airport connections.
 Commuting
Driving
 Air Travel
Air Travel
CHC — Domestic Routes
CHC — International Routes
Routes reflect scheduled services as of early 2026. Seasonal and charter routes may vary. Drive time via OSRM open-source routing. Check airline websites for current schedules.
 Planned & Recent Infrastructure
Major transport projects within range of this property that may affect commute times, property values, or construction noise during build.
Motorway extension from Papanui to Cranford Street opened 2021 — significantly reduces travel times for northern Christchurch suburbs.
 Services & Utilities
Rough estimates — actual costs vary by usage, retailer, and plan. "In rates" items are funded through your annual council rates, not billed separately. Total shows separately billed services only.
Electricity Electricity
Orion — the local electricity lines company for this area. These are network-wide averages; properties on underground cables in urban centres typically experience fewer outages than the network average.
Typical retail rate: approx. 28–35c NZD / kWh (incl. lines charge, 2025). Rates vary by retailer — the lines company is separate from your electricity retailer. Compare plans at powerswitch.org.nz ↗
Electricity distributed by Orion. Network average: ~2.0 hrs/yr without power (1.1 outages/yr) — below the national average of 3.4 hrs/yr. Christchurch city and mid-Canterbury plains.
Source: Commerce Commission EDB Performance Accessibility Tool (2022–23 annual report). SAIDI = System Average Interruption Duration Index (unplanned faults only, excluding planned maintenance). SAIFI = System Average Interruption Frequency Index. Network-wide averages only — address-level history unavailable. Contact oriongroup.co.nz/outages to report outages or check planned maintenance.
Potable Water SupplyTap Water Quality
This property is within the Central water supply zone, operated by Christchurch City Council (main water supply).
Source: CCC published water quality results. Single aquifer — chemistry is city-wide; chlorine dosing varies by zone. Data year: 2024. Christchurch does not fluoridate its water supply. A directive was issued in 2022 but implementation remains pending.
Water and sewerage status is inferred from the property’s location — urban areas are assumed to be on council supply. For definitive connection status, check your property’s rates assessment or contact your council directly.
Supply Reliability
Source: Taumata Arowai (Water Services Authority) compliance reporting ↗
 Mains Water Pressure
Pressure-zone source: Christchurch City Council GIS Open Data — Water Supply Pressure Zones (data year 2024). New Zealand councils set their own minimum service pressure; most design to about 250 kPa at the point of supply (varies by council). Actual pressure at the property varies with elevation, pipe age, and demand; the elevation indication is derived from terrain and is a guide, not a measurement.
 Wastewater & Sewerage
 Rubbish & Recycling
 Rubbish & Recycling
Kerbside collection for this area is managed by Christchurch City Council. Rubbish is collected via 140L wheelie bin, fortnightly.
| Service | Details | Type | Frequency | Cost |
|---|---|---|---|---|
 Rubbish Rubbish | 140L Wheelie Bin | Standard | Fortnightly | Included in Rates |
 Recycling Recycling | 240L Yellow Wheelie Bin | Standard | Fortnightly | Included in Rates |
 Organics Organics | 80L Green Wheelie Bin &Mdash; Food Scraps + Garden Waste Combined | Standard | Weekly | Included in Rates |
Rural note: Urban Christchurch: full kerbside. Banks Peninsula: partial via Wasteline (~5,000 households); remote areas use community collection points and transfer stations.
Red-lid 140L bin. Collected every two weeks, alternating with yellow recycling bin. Rates-funded via waste minimisation targeted rate.
Source: Christchurch City Council website (researched April 2026). Collection services and schedules may vary by street — check your council's online collection day tool for your specific address. Christchurch City Council — rubbish & recycling
 EV Charging Nearby
 EV Charging Nearby
Nearest public charge point: 1.0 km.
Source: OpenChargeMap (openchargemap.org) — community-maintained database of public EV charge points. Status and availability may change; verify with the network operator before travelling.
 Internet
 Fixed-Line Broadband
Broadband technology available at this address, based on NZ Broadband Map data. Actual speeds depend on your chosen ISP plan — the figures below are the maximum advertised speeds from providers serving this location.
Source: NZ Broadband Map (broadbandmap.nz) operated by InternetNZ. Data as reported by network providers — confirm with your ISP before purchasing. NZ fibre networks: Chorus (nationwide), Enable Networks (Christchurch), Ultrafast Fibre (Waikato / Bay of Plenty / Taranaki / Hawke’s Bay), Northpower Fibre (Whangarei).
 Mobile Network Performance
Ookla Speedtest open data for the nearest ~610 m grid tile (156 m from this property, based on 1 speed test across 1 device). Aggregated across all mobile operators — individual carrier performance may vary.
Fast 4G/5G — suitable for video calls, streaming, remote work
Source: Ookla Speedtest open data Q4 2025. Tile-level aggregate — performance varies by carrier, device, and time of day. Data does not distinguish between 4G and 5G networks. New Zealand has three mobile networks: Spark, One NZ (formerly Vodafone), and 2degrees.
 Gas Connection
 Gas Connection
Source: Vector Gas and Firstgas open network data. Confirm with your gas retailer before assuming no connection.
 Solar Energy Potential
 Solar Energy Potential
Long-term average solar resource at this location, based on satellite-derived irradiance data. Rated Very Good for solar panels — +8.7% vs NZ average, comparable to Christchurch.
Estimated Panel Output & Savings
| System Size | Annual Output | Est. Savings |
|---|---|---|
| 4 kWp (standard home) | 5,655 kWh/yr | $1,640/yr |
| 6.5 kWp (larger home) | 9,189 kWh/yr | $2,665/yr |
Savings estimated at 29c/kWh (NZ average residential price). Actual savings depend on self-consumption ratio, export tariff, panel orientation, and shading. Output assumes crystalline silicon panels at optimal tilt.
Solar Hot Water
The same rooftop sunshine can heat water directly with a solar hot-water system — a complementary option to panels rather than an alternative. Because solar-heated water displaces electric or gas water heating directly, it is often one of the lowest-cost ways to put this location's solar resource to work.
Based on a standard 4 m² collector and a typical household hot-water demand of 3,500 kWh/year. Actual performance depends on household size and hot-water use, collector type (evacuated-tube systems perform better in cold or cloudy conditions than flat-plate), shading and roof orientation. A backup heat source is still needed for winter and peak demand.
Source: Global Solar Atlas (globalsolaratlas.info) — World Bank / Solargis. Data period: 1999–2018 satellite imagery. Resolution: ~1 km.
Wind Energy Potential Wind Energy Potential
Estimated Annual Output & Savings
| Turbine Size | Typical Use | Annual Output | Est. Savings |
|---|---|---|---|
| 1.5 kW micro turbine | Small home / supplement | 2,068 kWh/yr | $703/yr |
| 5 kW small turbine | Larger home / lifestyle block | 6,894 kWh/yr | $2,344/yr |
Savings estimated at 34$/kWh average residential rate. Estimates assume a 30 m hub height in open terrain. Urban sites typically produce 20–40% less due to turbulence. Actual output depends on local wind regime, tower height, turbine model, and installation quality.
Planning rules are set by your local district council under the Resource Management Act 1991. Many district plans allow small turbines as a permitted activity (no resource consent needed) if they are below a height threshold — typically 6 m above the building roofline or 6–10 m standalone — and meet setback and noise limits. Exact rules vary by district; check your local district plan before installing.
Wind speeds are long-term satellite-derived averages at ~1 km resolution. Output estimates use a simplified Rayleigh wind distribution and a typical small-turbine power curve (cut-in 2.5 m/s, rated 11–13 m/s). Site-specific assessments and anemometer measurements are recommended before any installation decision. Source: ERA5 climate reanalysis via Open-Meteo (archive-api.open-meteo.com), 2019–2023. Resolution: ~31 km..
 Methodology & Limitations
Understanding the Benchmarks
Understanding the Benchmarks
Set by the World Health Organization based on the best available global health research. They represent the levels below which health risks become negligible for most people. They are not legally enforceable in New Zealand — no NZ law requires compliance with them — but they are the internationally accepted scientific standard. The 2021 WHO air quality guidelines are the strictest ever published, tightened significantly from the 2005 values.
Set under New Zealand's National Environmental Standards (NES) for Air Quality (2004, amended 2011) and noise standards NZS 6802:2008 / NZS 6805:1992. These are district-level targets that regional councils must manage across their area — they do not apply to individual households. NZ standards are often less stringent than WHO guidelines, reflecting economic and practical constraints rather than pure health science. A property can sit above WHO guidance while still being within NZ standards.
This report synthesises data from the New Zealand Police, Stats NZ Census, Christchurch City Council, the National Institute of Water and Atmospheric Research (NIWA), WHO guidelines, and validated geospatial interpolation models for air quality, noise, and environmental metrics. Results represent area-level estimates with a mean absolute error of approximately 2 µg/m³ for PM2.5 concentrations and should be interpreted as indicative for the property location rather than site-specific measurements.
Data Sources
| Category | Source | Type |
|---|---|---|
| Air quality (PM2.5, PM10) | LAWA (Land Air Water Aotearoa) ambient monitoring stations | ML model trained on measured data |
| Trace gases (NO₂, O₃, SO₂, CO) | CAMS EAC4 reanalysis (Copernicus Atmosphere Monitoring Service) | Satellite reanalysis (~40 km resolution) |
| Meteorology | ERA5 reanalysis via Open-Meteo (temp, wind, rain, humidity); NIWA 1991–2020 normals (sunshine) | Gridded reanalysis + station normals |
| Road network & traffic | NZTA (Waka Kotahi), OpenStreetMap | AADT counts, road geometry |
| Traffic noise | CoRTN (Calculation of Road Traffic Noise) model | Physics-based model with EDT attenuation |
| Aircraft noise | Published airport Ldn contours + ILS approach corridor model | Contour data + 3° glideslope model |
| Railway noise | OpenStreetMap railway data | Line-source decay model |
| Crime | NZ Police victimisation data (Apr 2022 – Sep 2025) | Area unit counts, ANZSOC categories |
| Demographics | Stats NZ 2023 Census (SA2 level) | Official census data |
| Schools | Ministry of Education, schoolzones.moe.govt.nz | Enrollment zones, EQI, roll data |
| Land use / topography | LINZ (Land Information NZ), Stats NZ | Land cover, elevation, zoning |
| Airport routes | Wikipedia (weekly scrape) + airline schedules | Community-maintained, verified periodically |
| Climate comparison | Open-Meteo archive API (ERA5), 176 NZ towns cached | 12-month rolling daily data |
| Commute / routing | Google Maps Directions API, OSRM | Driving, cycling, walking, transit routes |
| Pet friendliness | OpenStreetMap Overpass API, LAWA freshwater monitoring | Green space, water quality, road safety |
| Places & amenities | Google Places API, OpenStreetMap Overpass API | Parks, gyms, supermarkets, takeaways, restaurants, vets, etc. |
| Council rates | Published council Annual Plan rates | Estimated from capital value × published rate in the dollar |
| Rental market | HUD Local Housing Statistics (data.govt.nz), MBIE bond data | TA-level median rents from tenancy bond lodgements |
| Suburb rental bonds | MBIE Tenancy Bond Data (tenancy.govt.nz) | SA2-level median rents by bedroom count, quarterly |
| Property prices | HUD Local Housing Statistics (data.govt.nz) | TA-level median sale prices, updated monthly |
| Solar potential | Global Solar Atlas (World Bank / Solargis) | Satellite-derived irradiance, ~1 km resolution |
| Maps | CARTO / OpenStreetMap (Leaflet) | Base map tiles |
AI-Generated Content
Important: some text in this report is generated by AI
Narrative paragraphs (section summaries, climate descriptions, national park blurbs, and per-person suitability assessments) are generated by AI language models and may contain inaccuracies, generalisations, or hallucinations. These narratives are based on the data shown in the charts and tables, but the AI may occasionally misinterpret, exaggerate, or invent details not present in the source data.
Charts, tables, maps, scores, and numerical values are computed directly from the data sources listed above and are not AI-generated. When in doubt, refer to the charts and numbers rather than the narrative text.
Limitations
- Air quality predictions are area-level estimates at 100 m grid resolution with an average mean absolute error (MAE) of approximately 2 µg/m³ for PM2.5. Actual concentrations at any specific point may differ due to hyper-local factors (e.g. a neighbour’s wood burner, a nearby construction site).
- Trace gas data (NO₂, O₃, SO₂, CO) from CAMS is at ~40 km satellite resolution — it represents regional background levels, not street-level pollution. Urban hotspots may be underestimated.
- Noise modelling uses road traffic counts and physics-based decay — it does not account for barriers (fences, buildings, terrain cuttings), surface type, or intermittent sources (construction, events, barking dogs).
- Crime data reflects reported incidents only. Actual crime may be higher (under-reporting) or lower (boundary effects). Rates use the most recent Census population estimates.
- School zone boundaries may change between enrollment periods. Always verify with the local education authority before making decisions based on school zones.
- Commute times are from Google Maps and represent typical conditions — actual times vary with traffic, roadworks, and weather.
- Airport routes are scraped from Wikipedia weekly and may not reflect schedule changes, seasonal services, or charter flights. Check airline websites for current timetables.
- Model year is 2023 for air quality and noise. Conditions may have changed since the model was trained.
Disclaimer
This report is produced by SpotCheck for informational purposes only and does not constitute professional advice of any kind — environmental, legal, financial, or otherwise. SpotCheck accepts no liability for decisions made based on information in this report.
Data is sourced from third-party providers and publicly available datasets. While we make reasonable efforts to ensure accuracy, we do not guarantee that the data is complete, current, or error-free. Always verify critical information independently — conduct your own due diligence, obtain professional assessments (e.g. LIM report, building inspection, environmental consultant), and consult qualified advisors before making property decisions.
SpotCheck is not a licensed real estate agent, property valuer, environmental consultant, or legal advisor. This report should be used as one input alongside your own research, professional advice, and on-site inspection of any property.
Independence
This report was produced independently by SpotCheck. SpotCheck is a third-party service with no affiliation to any real estate agency, developer, or property listing platform. We do not receive commissions, referral fees, or any form of payment from the property industry. Our reports are funded entirely by our customers. Read our full independence promise.
Iconography: animal & pet icons via Material Design Icons (Apache 2.0), Phosphor (MIT), and game-icons.net (Lorc, Delapouite & contributors, CC BY 3.0).
Is this property right for your family?
This is a seller/landlord report — the same data for every viewer. With a Homebuyer Report, Spot gets to know your household first: who lives with you, where you work, what schools the kids need, whether the dog needs off-lead parks, and what matters most to you. Every section is then written from your family’s perspective — so you can see at a glance whether this place is genuinely the right fit for your wellbeing.
Get a Homebuyer Report for this address →Same price · same data · tailored to your family
How can this report be improved?
Your feedback goes directly to the SpotCheck team.
We read every message and use it to make reports more useful for everyone.